On the other hand, low-volume coins are known for frequently experiencing dramatic price swings, increasing risks and volatility, and pump-and-dump schemes that have been causing many losses in the crypto market recently.
Assessing Liquidity with High Trading Volume
Higher volume implies higher liquidity, which makes it easier to execute buying and selling orders, increases trading opportunities, reduces erratic price behavior, and significantly reduces market manipulation techniques and scams.
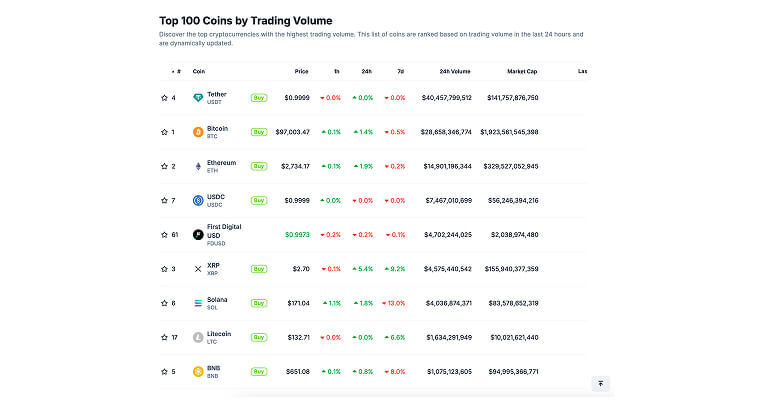
The CoinGecko website has a page dedicated to listing the Top 100 Coins by Trading Volume based on the 24-hour trading volume. In general, an ideal trading volume level in cryptocurrency markets would be in line with the values below:
| Category |
Minimum 24-Hour Trading Volume in USD |
| Top 10 Cryptocurrencies |
Over $1,000,000,000 |
| Top 100 Cryptocurrencies |
Over $50,000,000 |
| Other Cryptocurrencies |
Over $10,000,000 |
Based on the table above, cryptocurrencies like Bitcoin and Ethereum in the top 10 would typically need a daily volume of over one billion dollars to ensure efficient trading. For the other cryptocurrencies in the top 100, a lower threshold of around 50 million dollars would be enough. On the other hand, altcoins would require a volume of around 10 million dollars to be considered “safer” to trade, considering volume is indeed much lower in these cases.
These values are – of course – approximate. They can vary depending on specific market conditions and regional differences.
Volume-to-Market-Cap Ratio
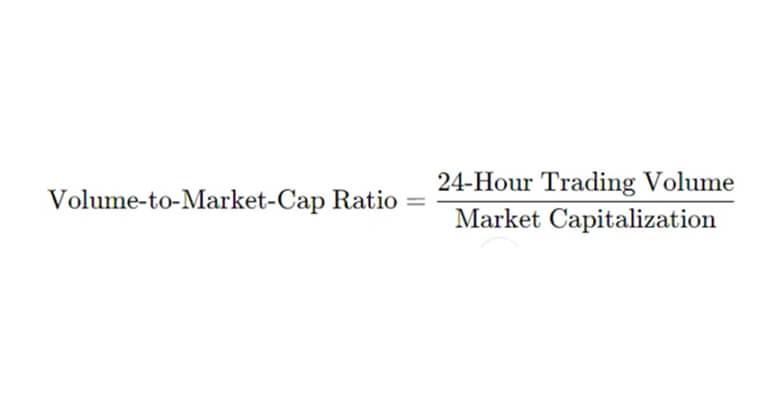
The volume to market cap ratio is yet another metric that measures what makes an ideal volume for trading. This metric is the 24-hour trading volume data and the market capitalization ratio.
Overall, a “good” or high ratio, 10% or higher, means that people are heavily trading the coin, which indicates high liquidity and strong interest from buyers and sellers, making it easier to trade and safer. A ratio below 1% signals extremely low liquidity, which makes it much harder to trade and more prone to scams.
Impact of Position Size According to the Total Volume
When trading, you must consider the impact of position size according to the trading volume. If you plan to place a $10,000 order, for example, executing that order in crypto with a low volume might cause a massive impact on the cryptocurrency price.
A safe trade would generally require the daily volume to be at least ten times the size of your order. This is a conservative metric that helps you ensure that the trade will have a minimal impact on price. Practically, if you plan to trade $1,000 worth of crypto, its daily volume should be at least $10,000. In this case, the order fits comfortably within the ongoing activity, preserving the balance between buying and selling pressures while reducing the risk of a sudden price reversal.
The table below illustrates the minimum safe trading volume based on different order sizes, considering that we aim for a trading volume that is 10 times the size of the order.
| Order Size |
Minimum Trading Volume |
| $100 |
$1,000 |
| $1,000 |
$10,000 |
| $10,000 |
$100,000 |
Volume as an Indicator of Liquidity
There is a deep connection between trading volume, price movement, and liquidity. Volume gives us insight into how much people trade a cryptocurrency, a measure of interest among market participants. High volume means there is a large pool of both buyers and sellers, leading to more liquidity. With greater liquidity comes the chance to trade safely without dramatically impacting the dynamic of prices.
Let’s consider the following:
Bitcoin (BTC)
Bitcoin is one of the most popular crypto in the market. Suppose that the last 24-hour trading volume is at $5 billion. In this scenario, the market can easily absorb a $50,000 order. The liquidity provided by the Bitcoin market reduces the slippage – the difference between the expected price of a trade and the actual price of execution, which can increase costs and expenses – and maintains a stable dynamic in price action.
RepubliK (RPK)
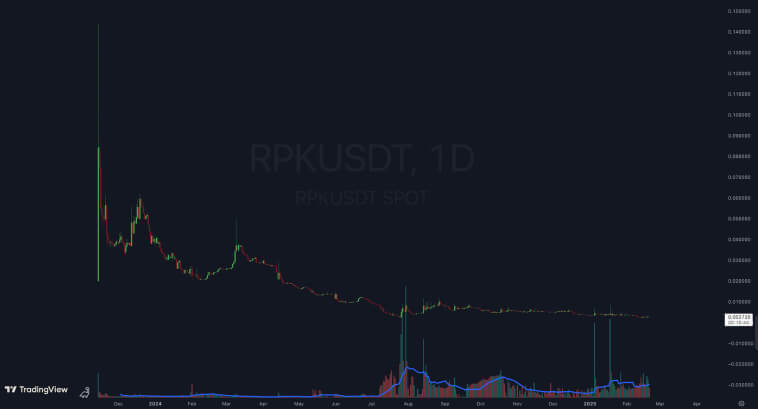
RepuliK, on the other hand, is an altcoin that exhibits a behavior typical of low-volume assets. You can see how the chart displays erratic price movements as imprinted by the extreme wicks/shadows on the upper and lower ends of candlesticks. These long shadows demonstrate the price spikes followed by immediate price reversals – often a suggestion of how certain buy or sell orders can dramatically affect prices.
Since liquidity is so low, a single large order can create a large spike in volume, making prices reach a level not backed by genuine interest from market players. The moment the buying pressure ceases to exist, for example, the price collapses just as quickly as it rose, trapping those who entered at the peak.
Price action is highly sensitive in this low-liquidity market, making it difficult for people to execute significant orders without experiencing extreme price volatility. The volume indicator at the bottom of the chat shows sporadic bursts of activity, indicating low market participation in RPK. These conditions make this altcoin extremely susceptible to manipulation and other scams, making it extremely risky for retail traders who can be lured in by temporary rallies only to be trapped in a sudden reversal.
Indicators to Measure Volume for Better Trading Strategies
Volume indicators are extremely important tools for any crypto trader who wants to understand market sentiment and assess the liquidity of any particular cryptocurrency. Let’s take a look at the most common technical indicators for assessing volume.
On Balance Volume or OBV
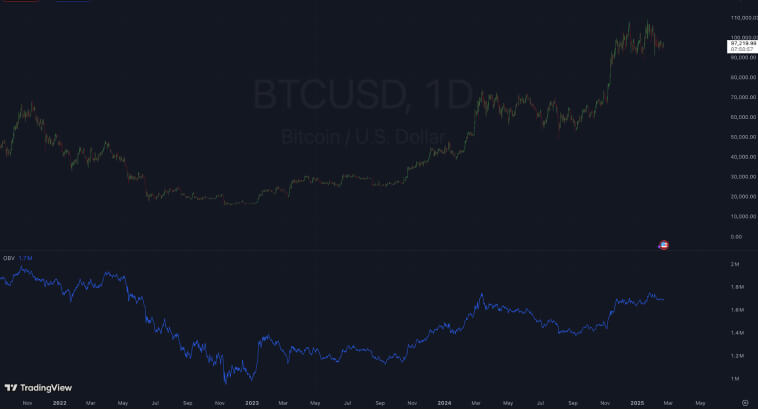
The OBV aggregates volume by adding volume on up days and subtracting volume on down days. This indicator helps you understand whether money flows in or out of the cryptocurrency. If Bitcoin, for example, experiences a short-term rally while OBV remains flat, it is a sign that price action lacks the support of strong trading volume, increasing the chance of a trend reversal.
In the image above, the OBV displays a clear correlation with price. The indicator was declining along the downtrend in Bitcoin by 2022. In early 2023, however, the OBV indicators started to rise right before the price followed, suggesting an accumulation phase where buying pressure was slowly being built – offering an opportunity by signaling that prices could be about to enter a bullish rally.
Money Flow Index or MFI
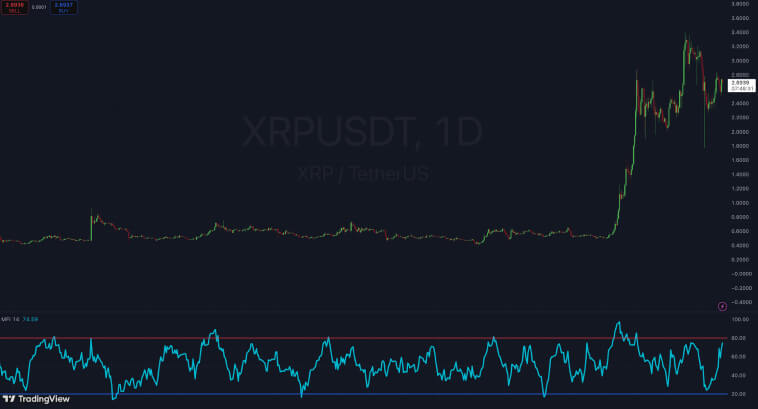
The MFI is very similar to the Relative Strength Index (RSI) indicator in trading systems. Traders use the Money Flow Index indicator to identify overbought (MFI > 80) and oversold (MFI < 20) levels, as well as price-indicator divergence for identifying price reversals.
The image above shows XRP reaching the overbought level, where prices cease to rise and bulls can’t push prices higher in the short term. The second price peak diverged from the indicator, leading to a false breakout – at least in the short term.
Volume Profile
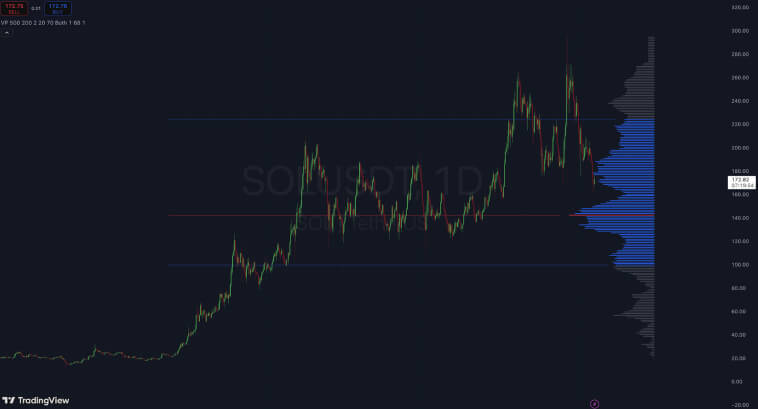
The Volume Profile indicator is a highly valuable tool that displays the trading volume by price levels looking back in time. Traders use this indicator to identify important support and resistance levels based on historical data.
In the image, SOL has a clear blue area showing price levels where a larger concentration of buying and selling activity takes place. These areas are, then, strong areas for support and resistance. It is possible to identify a resistance level around 220.00, indicating a lack of interest in SOL above this price level. On the other hand, the 100.00 serves as a strong support level in this case.