The RSI Indicator: Relative Strength Index and its Role in Technical Analysis
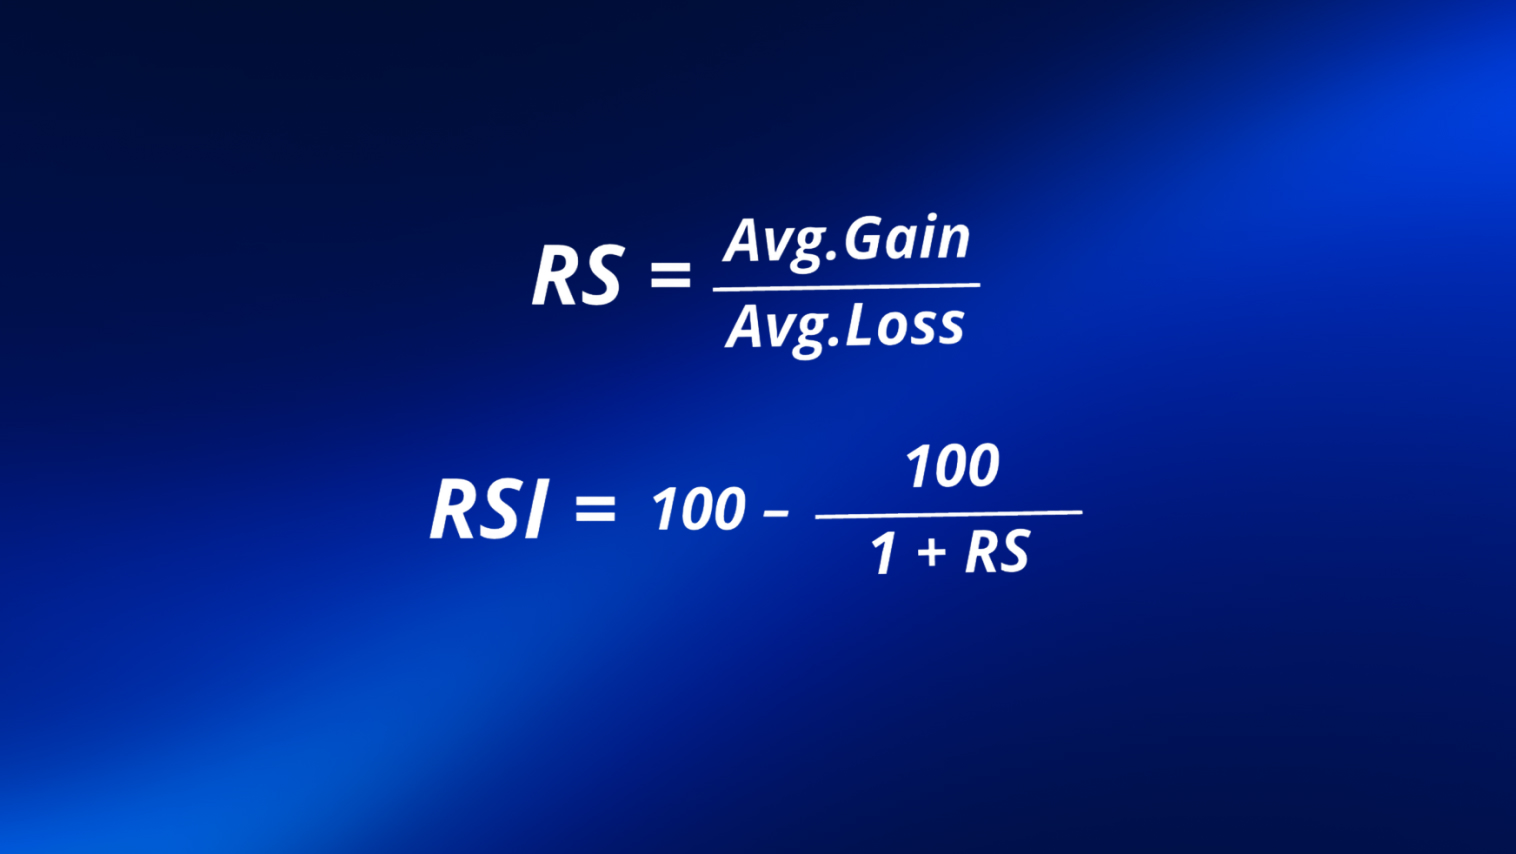
The Relative Strength Index (RSI) is a widely used momentum oscillator developed by American mechanical engineer Welles Wilder Jr. and introduced in 1978. To put it simply, the RSI measures the speed and magnitude of an asset’s most recent price changes to evaluate whether it is overbought or oversold. It compares the average of down moves to the average of up moves over a defined period, which by default is 14. Here’s how the RSI is calculated:
By observing the RSI, you can gain relevant insights into market conditions to trace a trading strategy. For example, an RSI above 70 indicates overbought conditions and can be a warning that prices have risen too far too quickly and may be due for a pullback. On the other hand, an RSI reading below 30 suggests oversold conditions, and prices may rebound at any moment.
Traders, however, use these more as warning signals. This indicator does not guarantee immediate price reversal. Prices can stay elevated, and RSI moves can remain in an overbought territory throughout days, weeks, or even months, especially during extremely strong trends. The main strength behind the RSI is its ability to smooth out price momentum and filter noise, making it useful to confirm trend direction and spot divergences between indicator and price trends.
The Stochastic Oscillator and How to Interpret its Signals
The Stochastic Oscillator is yet another momentum indicator created by George Lane in the late 1950s. While the RSI looks at average price gains and losses, the stochastic oscillator compares the latest closing price to the most recent trading range (i.e., the highest high and the lowest low). According to Lane’s premises, prices tend to close near the highest high of the period in an uptrend, while the opposite is true in a downtrend.
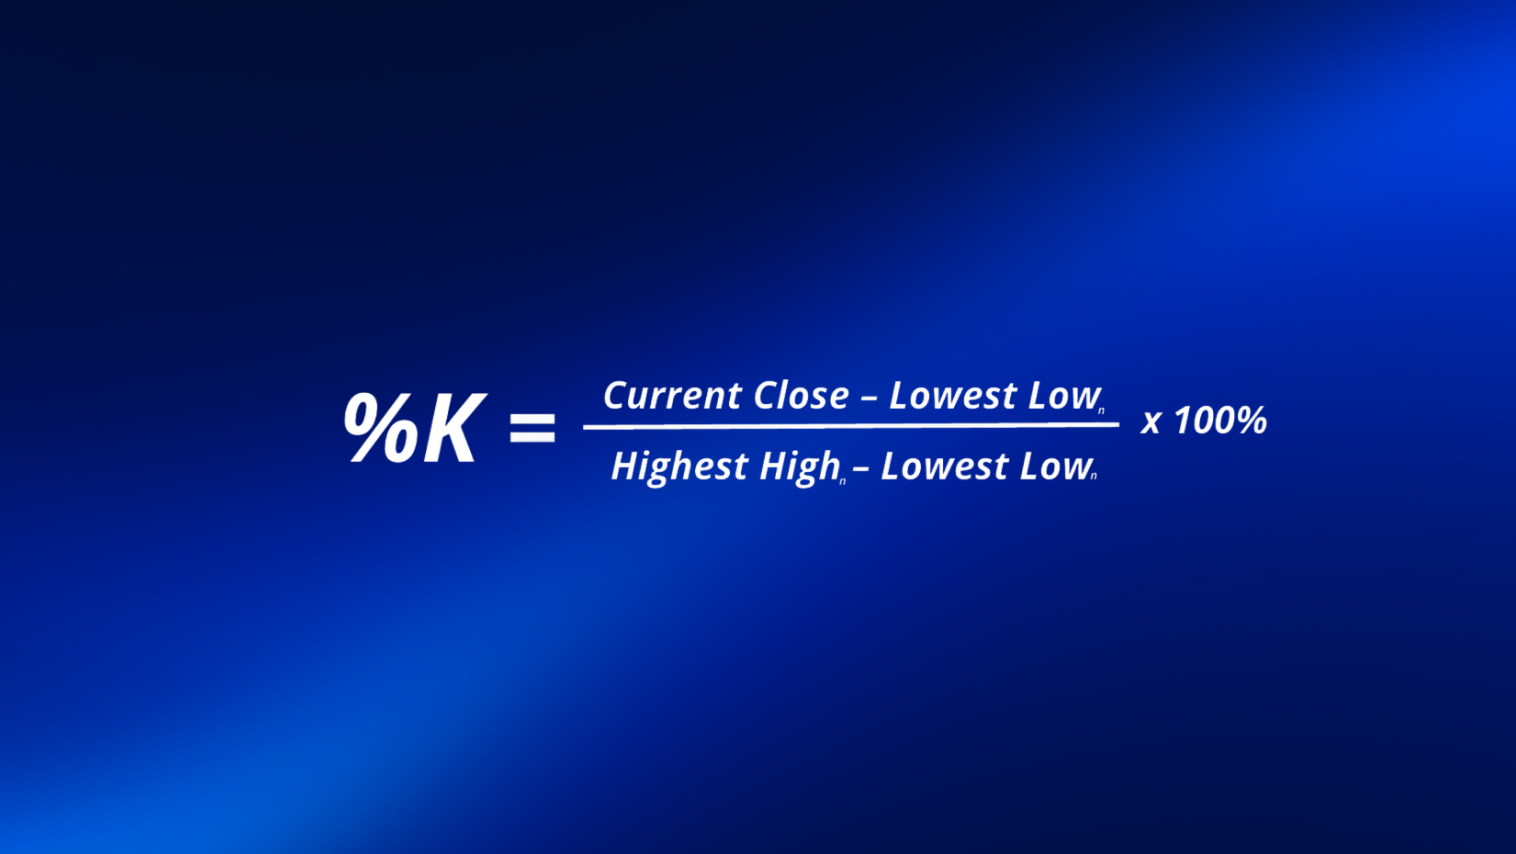
The stochastic indicator — also known as stoch —outputs a percentage between 0 and 100, indicating where the current close is relative to the range. It consists of two lines, %K and %D, where the former tells where the current close is relative to the range and the latter is a signal line that is simply a 3-period moving average of %K. Here is the stochastic oscillator formula for the %K:
The subscript n indicates the look-back period, which is 14 by default. A %K value of 0 means the current close is the lowest in the period, whereas a value of 100 means the closing is the highest.
Overall, most traders interpret stochastic values over 80 as a sign of overbought conditions, while values under 20 sign oversold conditions in the market. Traders also monitor the relationship between both the %K line and %D line. Whenever the %K line crosses below %D from above 80, that can be considered a sell signal. A buy signal is generated when the %K line crosses above %D from below 20.
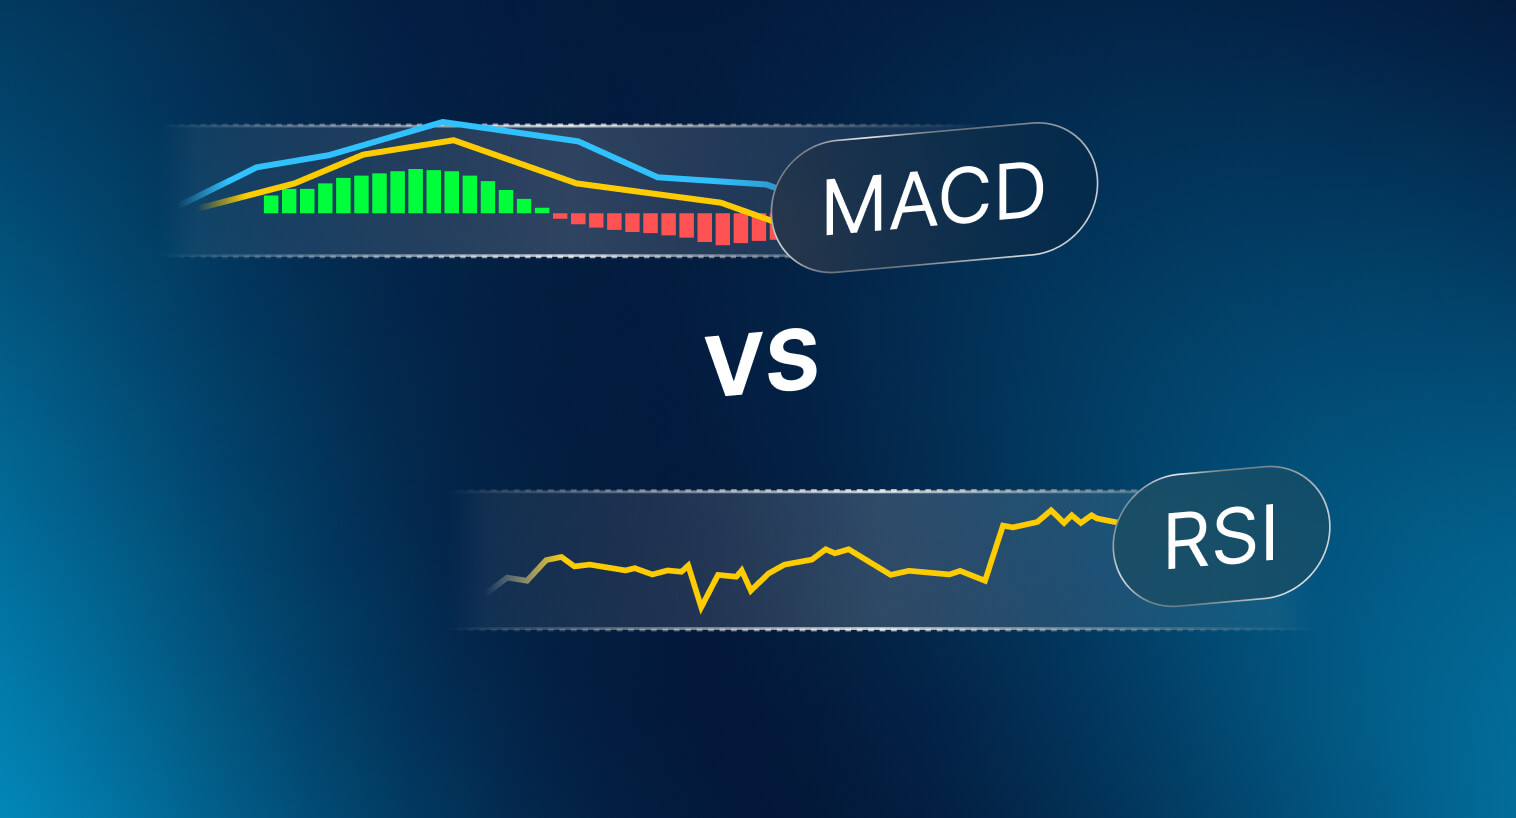
Relative Strength Index vs Stochastic Oscillator
Although both RSI and stochastic indicators are mainly used to identify overbought and oversold conditions, they do so in different ways. The differences between the two indicators can be summarized as:
- Calculation Method: The calculations of the RSI allow it to measure the speed and magnitude of price momentum via the comparison of average gains to average losses. On the other hand, the stochastic oscillator compares the closing price to its most recent high-low range. In the end, the RSI indicator tells you how strong the recent price movements have been, whereas stochastic tells you where the price closed relative to its price range. The stochastic is about closing price vs extremes.
- Overbought/Oversold Thresholds: RSI traditionally uses 70 and 30 as overbought/oversold levels, whereas the thresholds for the stochastic indicator are 80 and 20. These different levels reflect the different behavior of both indicators. The stochastic often reaches extreme levels much more frequently than the RSI indicator. For this reason, it is quite common to see the stochastic indicator above 80 or below 20 regularly, whereas it is a bit less frequent to see the RSI above 70 or below 30.
- Scale and Boundaries: Although both indicators move between 0 and 100, the RSI is normalized by its formula and rarely reaches 0 or 100 exactly, approaching these extremes only in strong trends. The stochastic, which is expressed as a percentage, reaches 0 or 100 if the current price close is at the extreme low or high of the chosen period. For this reason, we can say that the stochastic is more sensitive than the RSI, reaching extremes more often. Both indicators range from 0 to 100, making their signals and overbought or oversold conditions directly comparable, but they have different levels of sensitivity and behavior.
- Speed: Overall, the RSI indicator is smoother and slower for detecting short-term price action. The stochastic oscillator is more responsive, oscillating more than the RSI. In fast-paced markets, the stochastic can give several buy and sell signals in the short term, while the RSI might not move as much. It is crucial to understand the differences in speed of both indicators when deciding which one fits your trading profile better. The stochastic can generate a higher number of alerts, but also more false signals. The RSI’s slower nature can mean fewer false signals but sometimes a lag in explosive price reversals.
- Signals Components: The RSI chart has a single line, so analysts often pay close attention to when it crosses above or below key levels for entry signals. On the other hand, the stochastic consists of two lines, the %K and %D. The crossing of these two lines tends to be a major signal already. An example would be highlighting that %K crossing below %D is a bearish signal. We could say that interpreting the RSI is simpler, considering there is only one line to compare to fixed levels. Interpreting the stochastic involves analyzing the interaction between two indicators, the %K and %D lines.
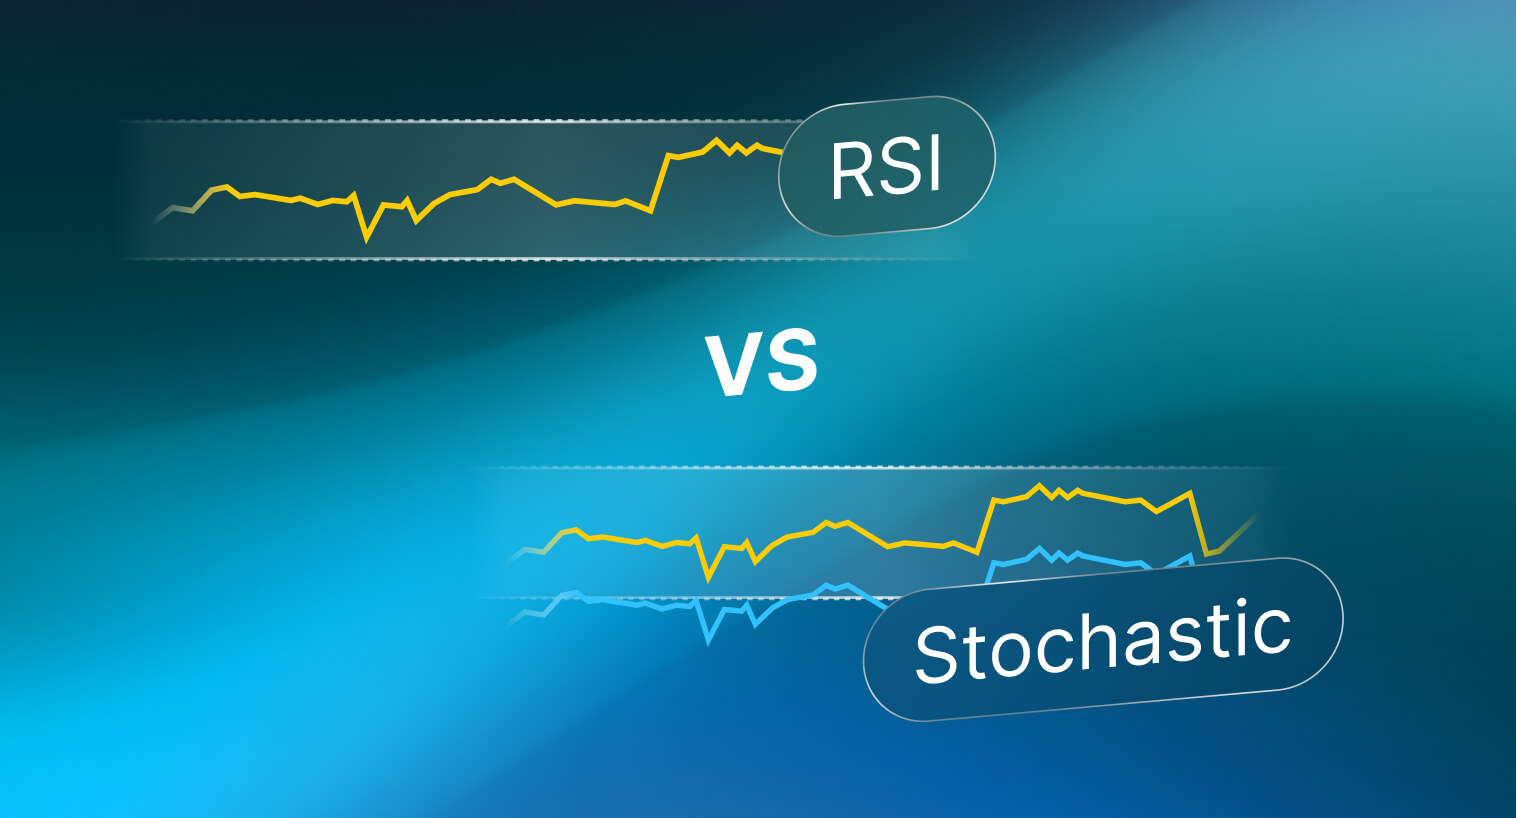
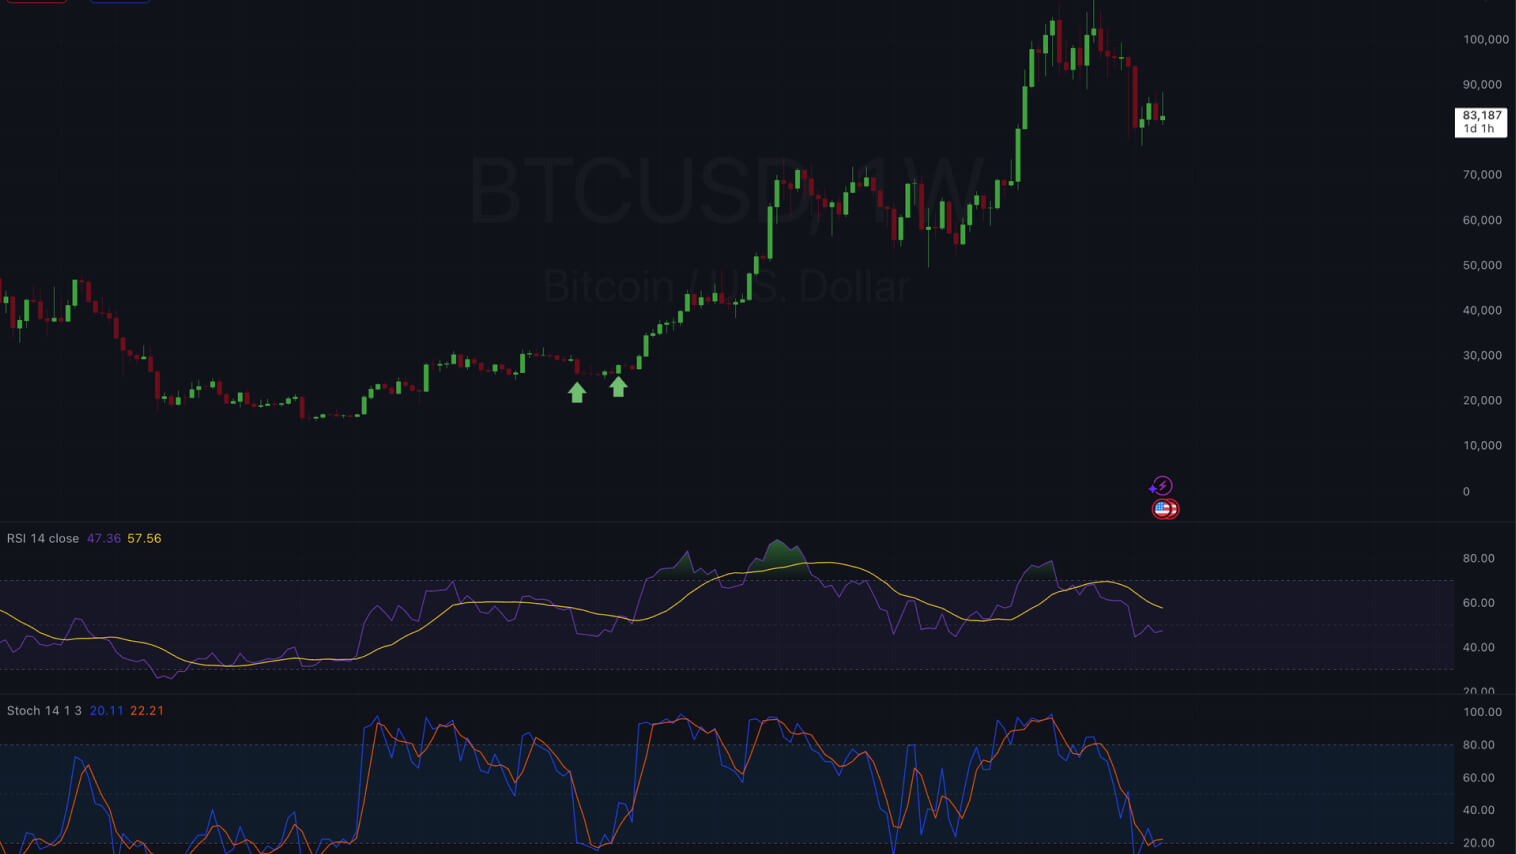
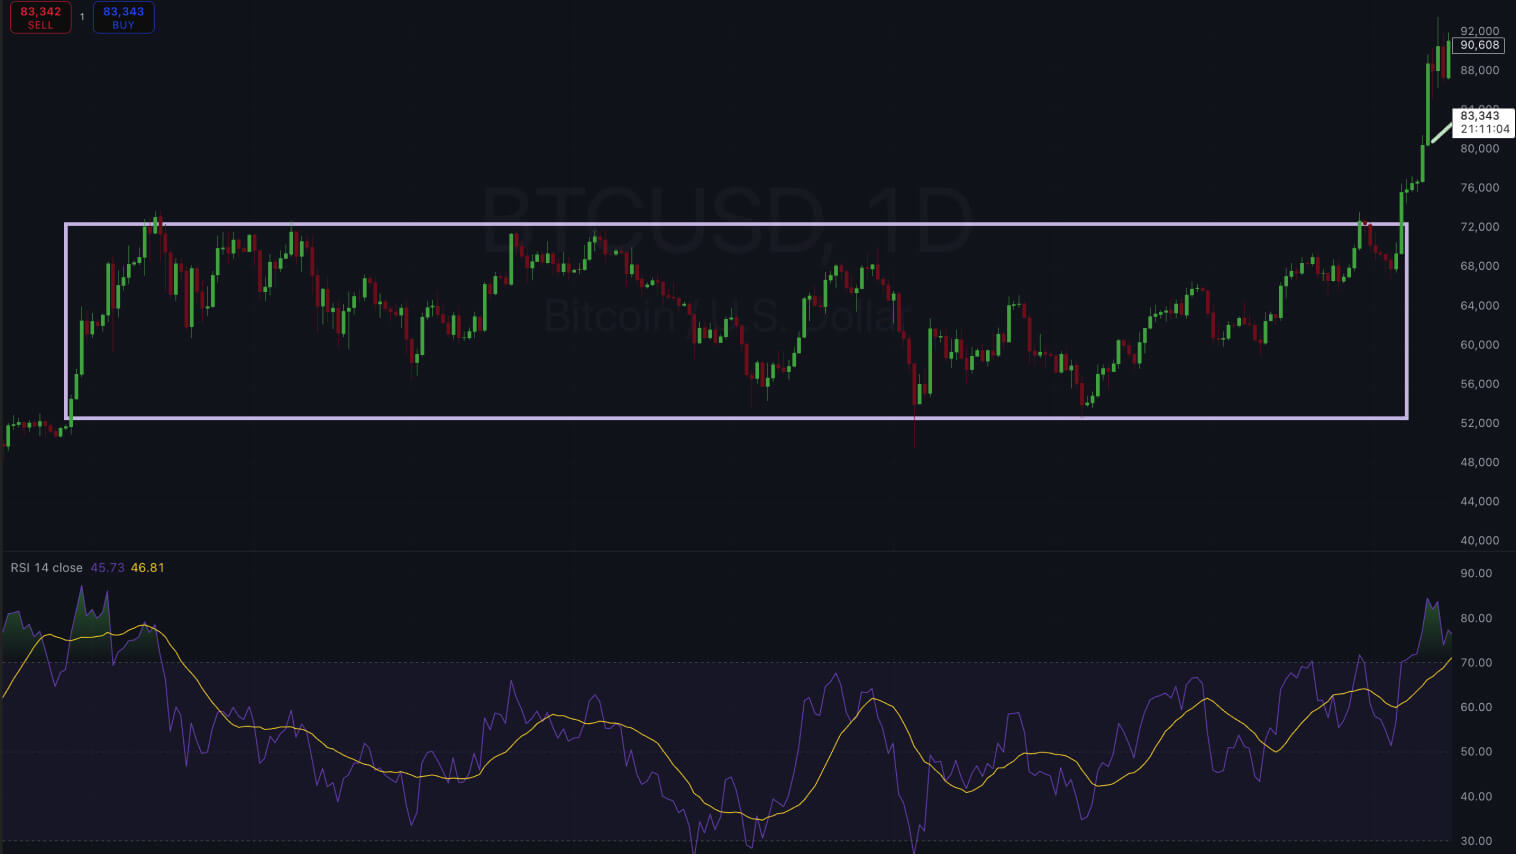
In the example below, you can observe how the RSI (with a moving average highlighted by the yellow line) remains relatively stable between 50 and 70 during an uptrend, briefly dipping during corrections but not frequently reaching extremes. The stochastic oscillator, however, shows much sharper movements, regularly swinging between overbought and oversold zones. This shows how the RSI provides smoother trend confirmation, while the stochastic is more responsive to short-term fluctuations.
The comparison table below should help you highlight the main differences between both.
| Aspect |
RSI |
Stochastic |
| Calculation Base |
Momentum of price movements (average gains vs average losses) |
Position of the closing price within a recent high-low range |
| Formula |
RS = average gain/average loss
RSI = 100 – 100/(1 + RS) |
%K = (Close – Lowest Low)/(Highest High – Lowest Low) x 100
%D = 3-Period SMA of %K |
| Overbought Level |
Above 70 |
Above 80 |
| Oversold Level |
Below 30 |
Below 20 |
| Use Cases |
Confirming trend strength; spotting divergence; and identifying possible trend reversal levels. |
Useful in identifying reversals in range-bound markets; entry and exit points during short-term swings; and quicker reactions for price movements under oversold or overbought conditions. |
| Sensitivity |
Slower and smoother changes. Fewer signals, filtering out noises. |
Faster and more volatile. Provides more entry signals but also generates more false signals. |
RSI and Stochastic Indicator: Advantages and Disadvantages
Relative Strength Index (RSI)
Advantages: People like using RSI due to its smooth calculation, and effectiveness in reducing false signals. Since it is based on averaged gains and losses, this indicator is considered much less sensitive to market noise, making it excellent for confirming trends and giving more trustworthy signals. During bullish trends, RSI values typically stay above 50, displaying strength. In bear markets, values remain below that same threshold. Traders also use the RSI to quickly spot divergences, where price and RSI diverge on the price chart, opening opportunities for potential buy and sell signals. It is straightforward, clearly marking key zones for identifying overbought and oversold conditions, offering an intuitive view of the market.
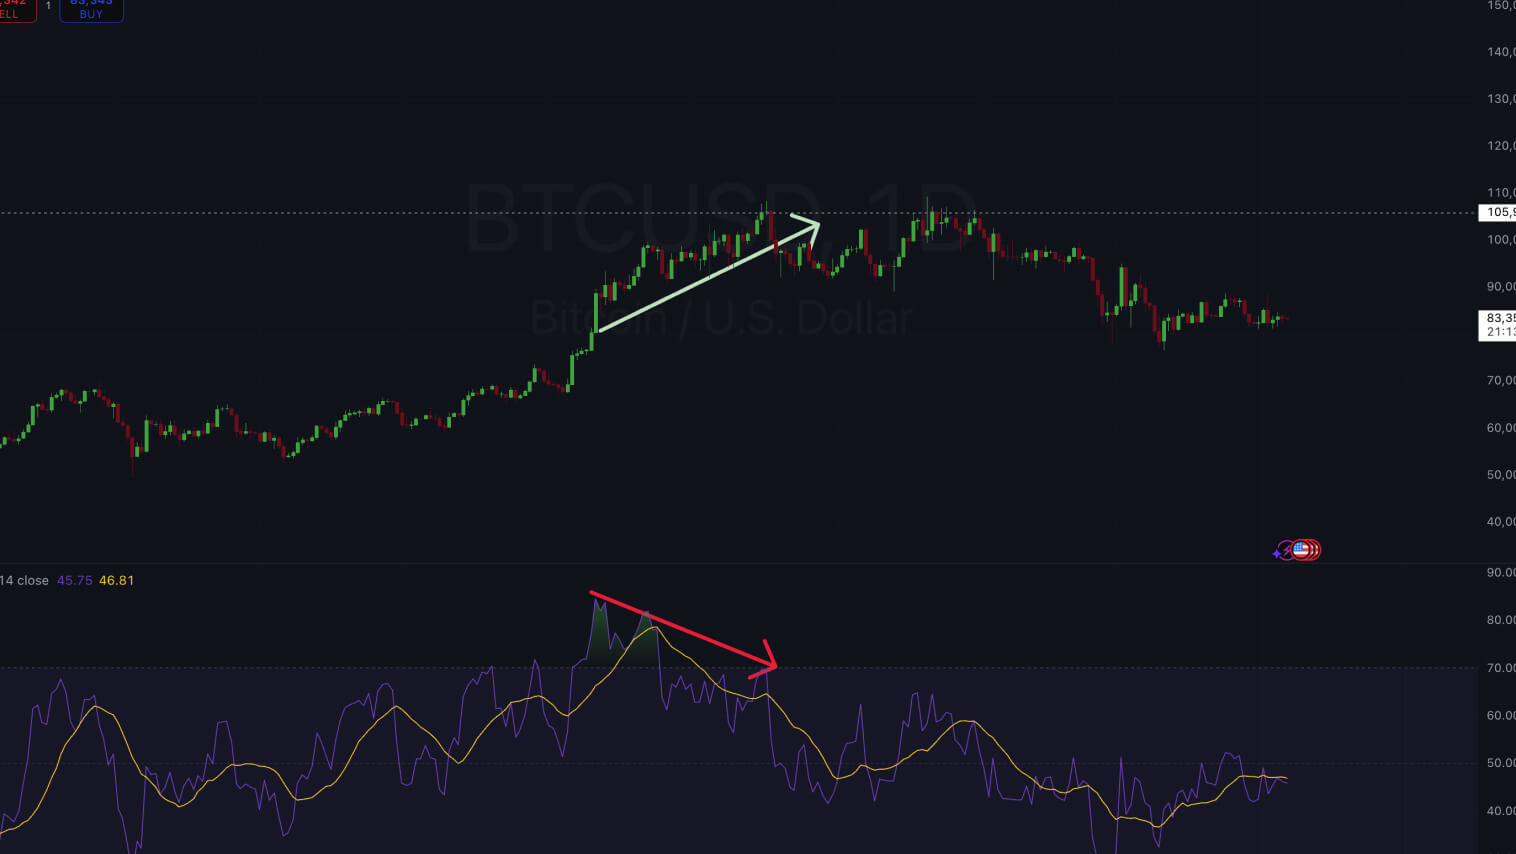
In the image above, it is possible to see the indicator pointing towards a divergence between the price and the RSI. Prices are not able to stay above the $105,959 level. This is one of the use cases of the RSI to help you spot divergences and weakening momentum.
Disadvantages: The RSI indicator can be somewhat less effective when explosive market movements occur, usually lagging behind sharp price reversals due to its smoothing effect. In strong trends, it can also remain under overbought or oversold conditions for extended periods, making these signals less significant without a broader context. Those who only plan their entries and exits solely based on the extreme zones of the RSI may end up opening several losing trades. Besides that, the RSI tends to perform much poorly during sideways markets, frequently staying around neutral levels and offering fewer opportunities to oscillators like the stochastics. The default 14-period RSI might also not be ideal for all markets or timeframes, requiring the trader to experiment and try different parameters before jumping straight to live markets trading.
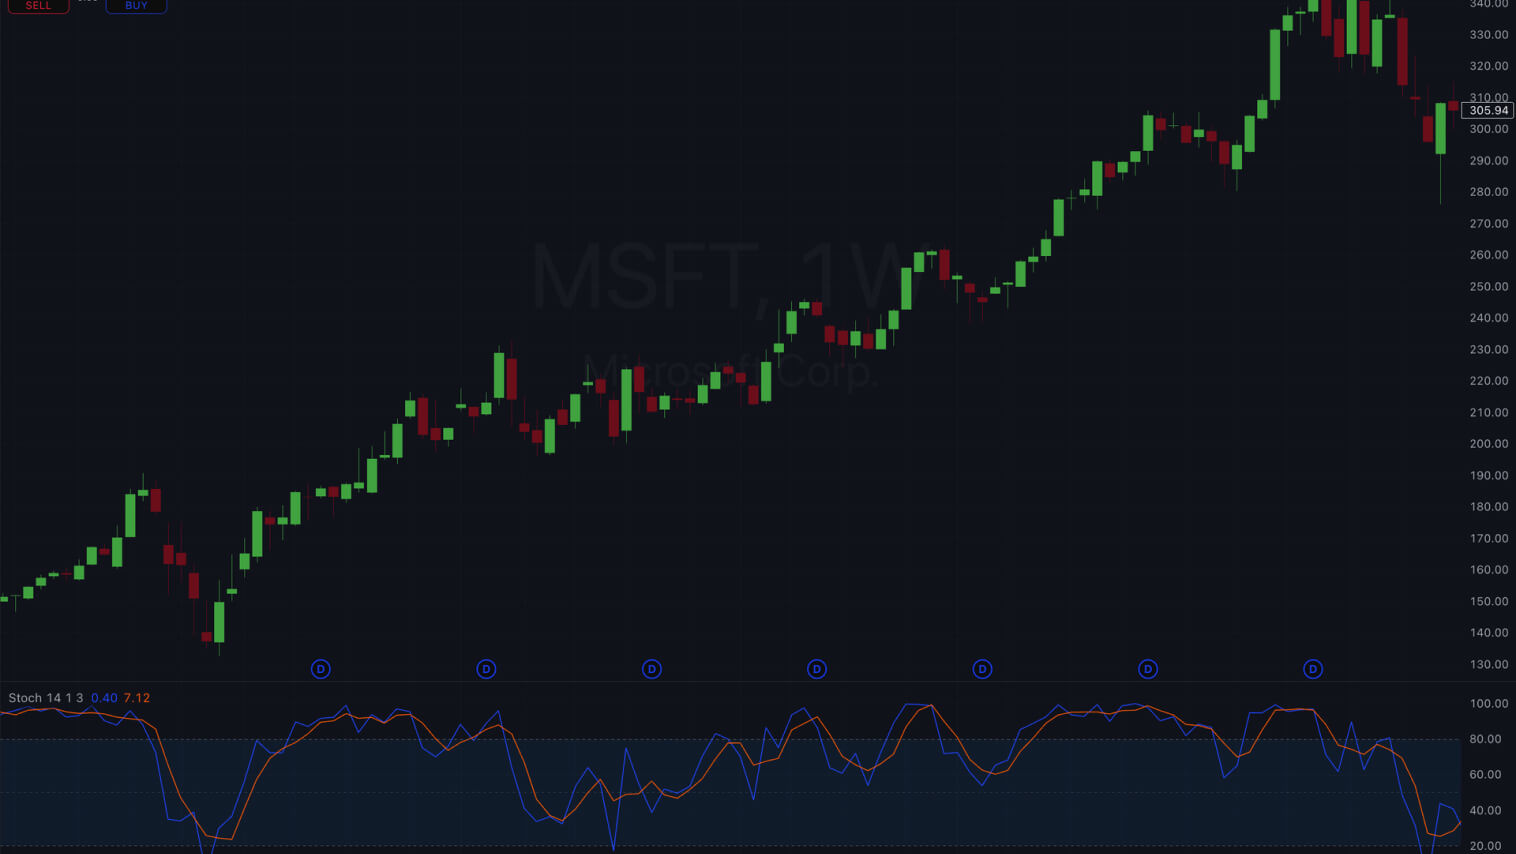
We have many erratic signals during range-bound markets and an overall lack of direction. The RSI bounces up and down its moving average.
Stochastic Indicator
Advantage: The stochastic oscillator is a momentum indicator highly valued for its responsiveness. It can quickly capture small shifts in momentum by showing where the price closed within the most recent range. It can be especially useful in sideways markets, offering clear signals when the %K line crosses above or below the %D line in oversold or overbought zones. Not only that, but it is relatively intuitive, making it easier to identify and interpret short-term moves compared to other oscillators. It also offers relevant insights when it detects divergences between the stochastic and price, signaling a weakening momentum to trends before a reversal happens early.
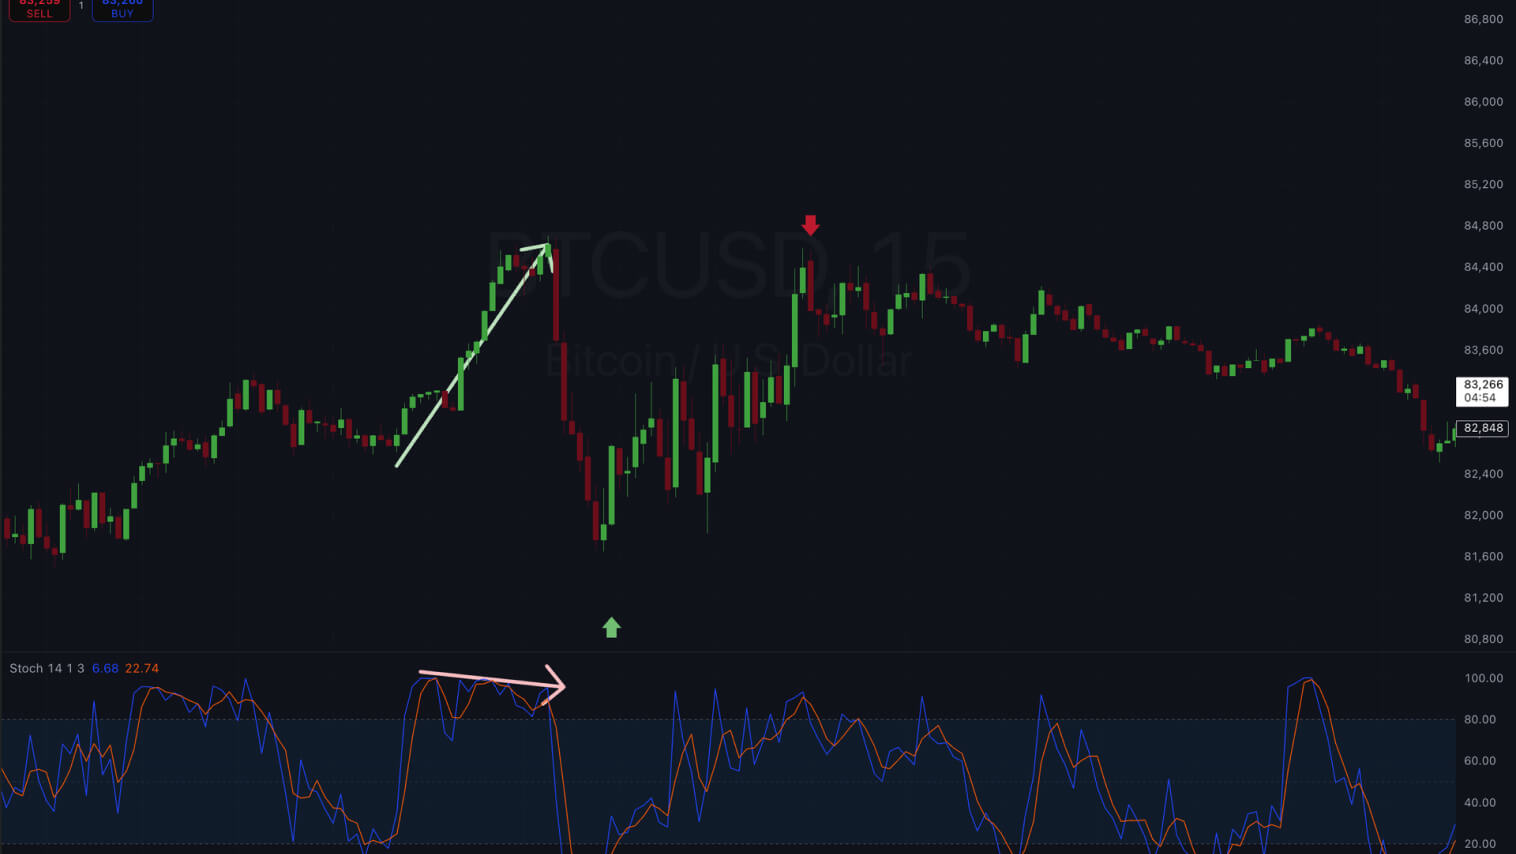
The image above shows examples of divergences, as well as long and short signals given the line crossings in key points.
Disadvantages: The sensitivity of the stochastic oscillator can become problematic in strongly trending markets, where it can frequently give false signals. This can mislead traders into premature entries, especially if they don’t use additional technical analysis tools to confirm the direction of the trend. Its performance heavily depends on choosing the right settings for a certain period. Too short periods cause excessive noise; too long diminishes its responsiveness. To mitigate these issues, traders may combine stochastic signals with a broader trend indicator, adjusting its parameters, or choosing to ignore signals against the main trend.
On well-established trends, the stochastic oscillator might give fewer relevant signals and not offer the right alerts to highlight the most optimal time to buy or sell assets.
Market Conditions: When to Use the RSI and When to Use the Stochastic Indicator?
Generally speaking, the RSI can be used in markets with a clear trend. In bullish markets, the RSI tends to remain elevated, oscillating between 40 and 80. Pullbacks during uptrends might only bring it down to the 40-50 zone before it goes back up, helping traders identify optimal points for adjusting their position or entering an uptrend in course. In bearish markets, it tends to stay suppressed between 20 and 60. Overall, an RSI above 50 indicates a strong bullish control over price, whereas below 50 suggests that bears are in control. Traders use the RSI to identify the main trend and avoid counter-trend trades.
In choppy, sideways markets, the stochastic oscillator outperforms the RSI. When the price oscillates between support and resistance levels, momentum oscillators like RSI might not reach relevant thresholds clearly, but the stochastic will capture these price swings more effectively. Trading strategies based on buying low and selling high with consolidation ranges benefit greatly from stochastic signals. In a horizontal channel, you can find buy and sell signals whenever the %K line crosses above or below the %D line when they are both near the 20 or 80 thresholds. In the same scenario, the RSI would hang around the 40–60 levels, not giving many relevant signals.
For day traders, the stochastic oscillator can be particularly helpful. It might give you more frequent signals when dealing with smaller price swings and more quickly provide relevant insights into the next price move. On the other hand, the RSI might be more suitable for long-term swing trading strategies.