MACD signals are generated whenever the MACD line crosses above the signal line for bullish signals or crosses below the signal line for bearish signals. These crossovers are especially relevant when they occur when the MACD line is near or below zero, an area seen as key for identifying trend shifts. A crossover above zero usually suggests a good time to buy amid a pullback. A drop below, on the other hand, may be a sign of a downtrend emerging.
The MACD histogram tells us whether momentum is accelerating or decelerating. Larger bars above zero reflect a strong bullish momentum. Smaller bars, on the other hand, indicate that the trend is losing strength. Negative bars growing downward illustrate increasing bearish strength, even if prices are still rising. Just like the RSI, you can use the MACD to find divergence and use it to anticipate potential price reversals, especially when confirmed by price action or support and resistance levels.
Since MACD relies heavily on moving averages, it may be slow to take in fast, explosive price moves. It does extremely well, however, in trending markets, frequently excelling at confirming longer trends, while the RSI pinpoints extremes.
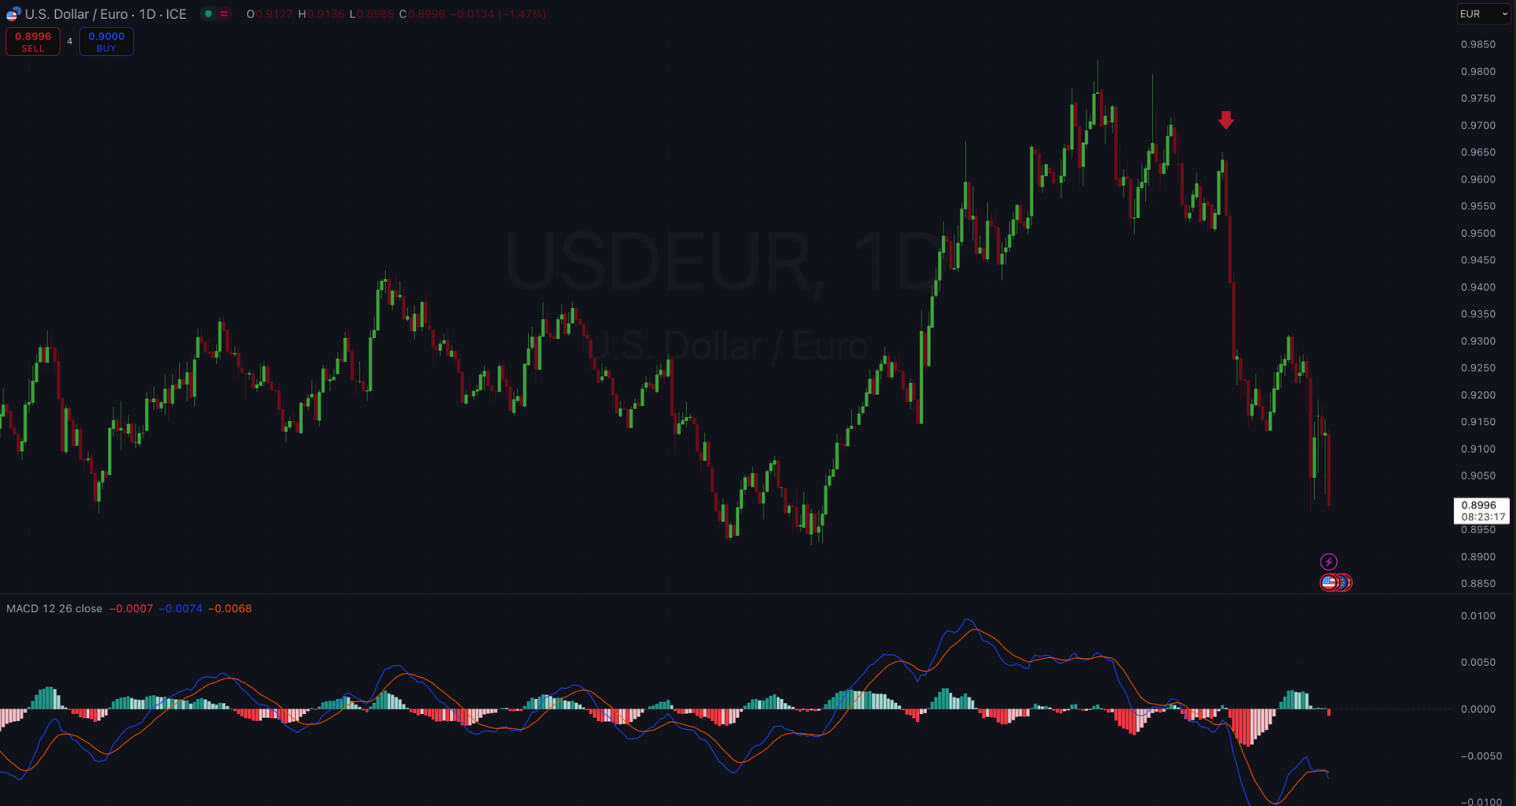
The blue MACD line crossing below the signal line with the histogram increasingly red and below zero allows us to go short when prices pull back to higher levels before dipping further.
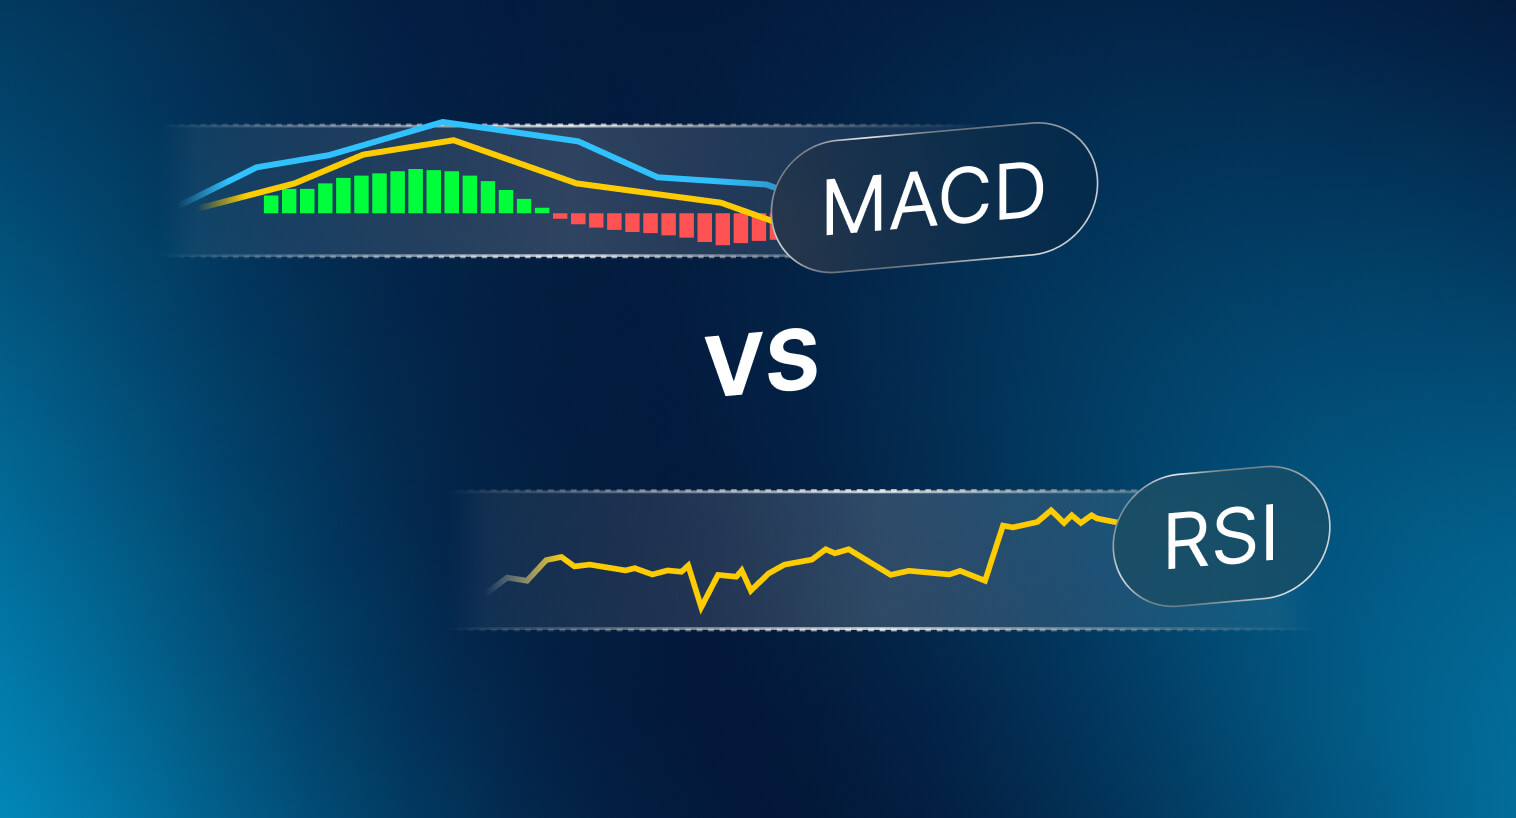
RSI vs MACD: Key Differences
Both RSI and MACD are momentum-based indicators. They are calculated differently and may serve different purposes. Below, we summarize their main traits and differences:
| Aspect |
RSI |
MACD |
| Indicator Type |
Momentum oscillator. Measures speed of price changes. |
Trend-following momentum indicator. Measures convergence and divergences of two moving averages. |
| Calculation |
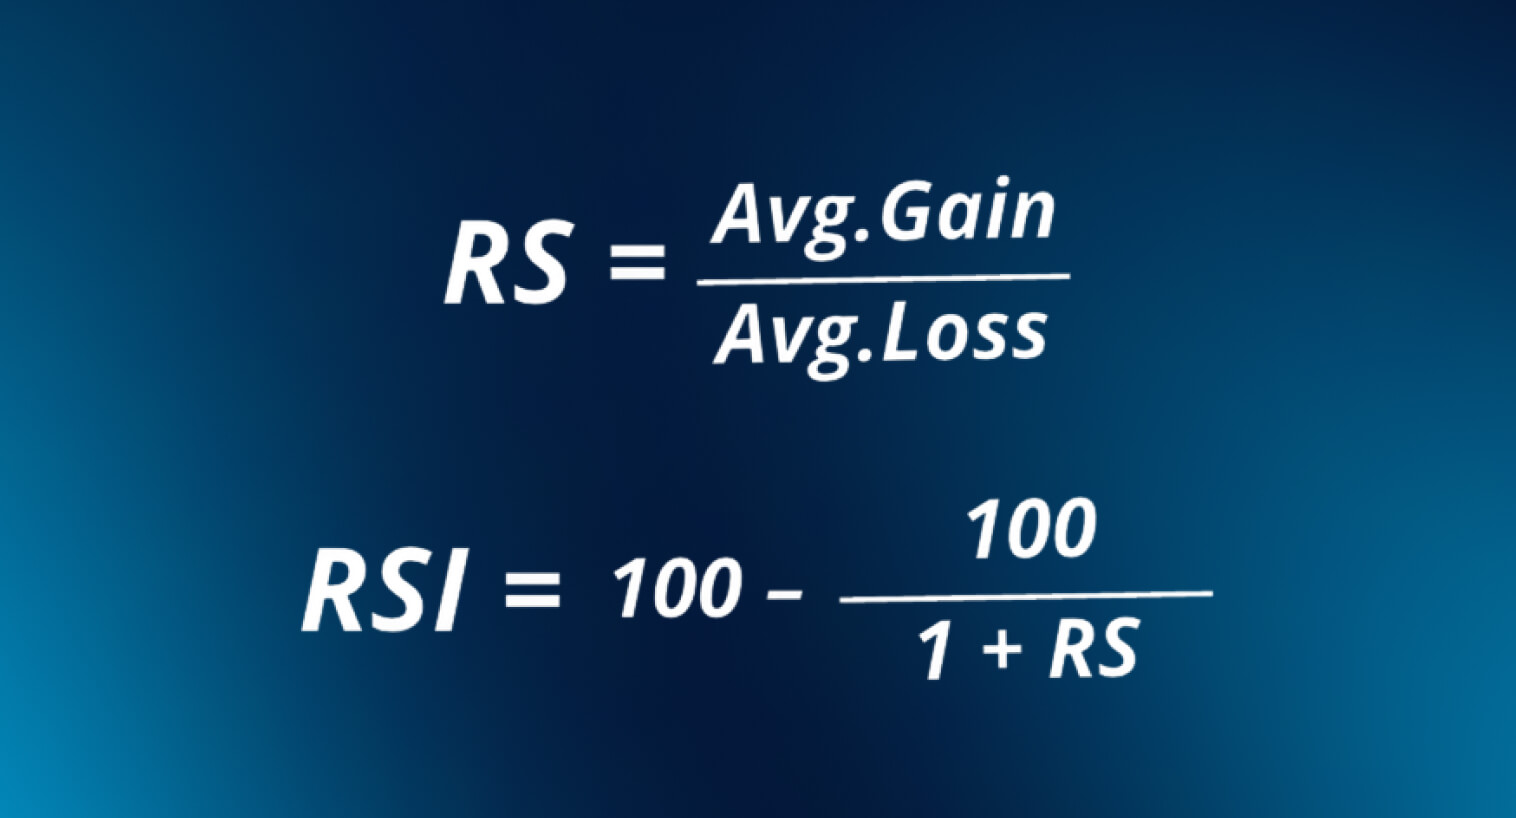
Based on average gains and losses over a lookback period. |
Based on the difference between two EMAs (MACD line) and an EMA of that difference (Signal Line). |
| Value Range |
0 to 100, where 70 indicates overbought and 30 indicates oversold. |
Not a fixed range. It oscillates above or below 0. It doesn’t really have fixed values for overbought/oversold levels. |
| Primary Signal |
Crossovers key levels (30, 50, and 70) are used to identify trend shifts. Divergences can indicate weakening momentum. |
Crossover signals indicate momentum shifts. Zero-line crossovers indicate changes in trends. Divergences can also indicate trend reversals early. |
| Strengths |
Excels in sideways markets. |
Excels in trending markets. |
| Weaknesses |
May give false signals when trends are extremely strong. |
May be slower to track explosive movements. Lots of false signals in directionless markets. |
| Best Suited For |
Identifying overbought and oversold conditions. |
Identifying and confirming trend direction and momentum. Useful for entry and exit timing in trending markets. |
| Visual Appearance |
Single oscillating curve with reference lines (30 and 70). Easy to spot extreme levels. |
Two lines that converge/diverge, plus a histogram. The zero line serves as a baseline. |
The RSI can be described as a leading indicator for potential reversals, whereas the MACD is more of a lagging indicator that confirms a trend or shift once it is underway.
When to Use RSI
The RSI excels in sideways markets, swing trading, and intraday price action. In range-bound conditions, it helps you identify turning points. Traders may buy when the RSI is around 30, indicating oversold conditions, and sell when the RSI approaches 70, indicating overbought conditions. When mixed with additional tools, you can more easily time entries and exits at relevant price zones, such as support and resistance levels.
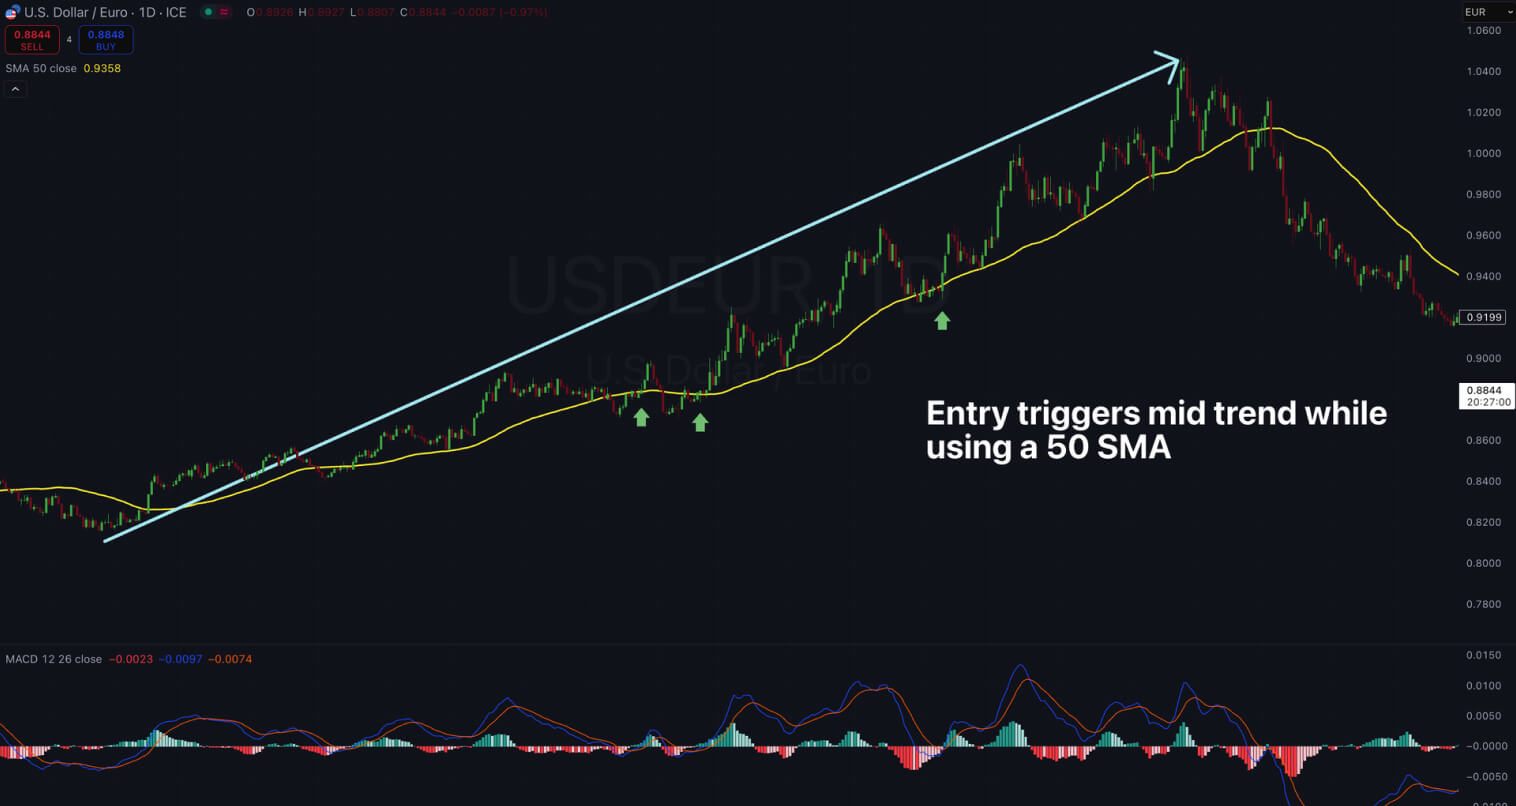
Pullbacks offer entry opportunities in trending markets. The RSI may remain under overbought conditions during extremely strong trends, so look for dips where the RSI drops to 50 or lower, and then goes back up to go long.
Day trades and other short-term traders usually use the RSI with shorter n periods, such as 7 or even 2. They can easily spot explosive and quick price movements in the intraday and the short term. For volatile assets like crypto, some traders may prefer to adjust the extreme thresholds to 80 and 20 to reduce noise. Divergences are also extremely helpful in highlighting possible tops or bottoms.
Optimal Settings for Traders
• 14-period for stocks and other general use cases.
• 8 to 10 for crypto and forex.
• 2 to 5 for day trading, with additional techniques for confirmation.
When to Use the MACD
The MACD thrives in trending markets. It uses two exponential moving averages of a security’s price, 12-period EMA and 26-period EMA by default, with crossovers to confirm momentum shifts. Many traders use MACD to know for how long they should stay in a trade, exiting only when the indicator indicates a trend shift.
Indicators like the MACD work extremely well across a diverse array of asset classes. In stocks, it confirms long-term strengths; in crypto, optimal settings can help track fast moves; in forex, it filters noise on daily and shorter timeframes.
The MACD can lag a bit since it is calculated by subtracting the 26-period EMA from the 12th. It is, however, reliable. By trying different settings and periods, you can find the most optimal configuration for your preferred use cases.
Optimal Settings for Traders
• Default (12, 26, 9) is suited for most markets.
• Shorter (6, 13, 5) for faster signals.
• Longer (20, 50, 10) for choppy markets.
Limitations of RSI and MACD
Although these two indicators are extremely powerful, they are not free from pitfalls. Here are some drawbacks to be aware of:
- False Signals: The RSI can stay under oversold or overbought conditions for extended periods of time, even moving back and forth around key levels without a trend reversal. The MACD, on the other hand, can display entry signals shortly before prices move in the opposite direction of the signal. Misleading triggers are common, especially in volatile assets or during events that may increase uncertainty.
- Lag and Delay: The MACD can stay behind and take a while to react to explosive price trends, due to its calculations based on moving averages of the price. The RSI indicator has similar behavior. This lagging effect can be reduced by using shorter periods, but that also has its own seatbacks–more market noise and false signals.
- Trend vs. Range Bias: The RSI may remain in the overbought levels during strong uptrends, which can lead to early exits or bad trades against the trend. The MACD shows more reliance in sideways markets, but it tends to produce false signals when close to the zero line.
- Divergences: Divergences are not always reliable. They will not lead to trend reversals every time. They can just preced a very short pause that wouldn’t be enough for a profitable trade. Multiple false divergences can occur during trends.
To mitigate these issues, you can always include the analysis of chart patterns and other chart analysis tools for identifying key levels for price action. Tuning settings and using effective risk management, such as employing stop-loss orders to protect against bad trades, are also effective. But you can also use the RSI and MACD together to boost your trading system.
Combining RSI and MACD Together for an Enhanced Trading System
Instead of having to decide which one to choose, some opt for combining MACD and RSI to leverage the strength of these two popular momentum indicators. When used together, they can give you a broader view of the conditions in the market.
How to Combine MACD and RSI
- Check Market Conditions: if prices are on a defined trend, you can rely more on the MACD for both trading and investing. If, however, the market is moving within a range, the RSI might be more useful.
- Use Multi-Timeframe Analysis: You can, for example, rely on the MACD to confirm the main trend on longer-term charts then drop to shorter-term charts with a shorter n period for the RSI to find more precise entries and exits.
- Look for Confluence: The main advantage of using these two together is their combined signals. When the RSI recovers from oversold levels and the MACD crosses the signal line with a raising histogram, that is a confluence of signals to go long. When the RSI drops from overbought levels and the MACD turns down, that is a confluence of signals to go short.
- Backtest and adjust: Always remember that each asset is different. It is crucial to backtest to find what sequence or timing works best for your trading system. Adjust and adapt when conditions change.
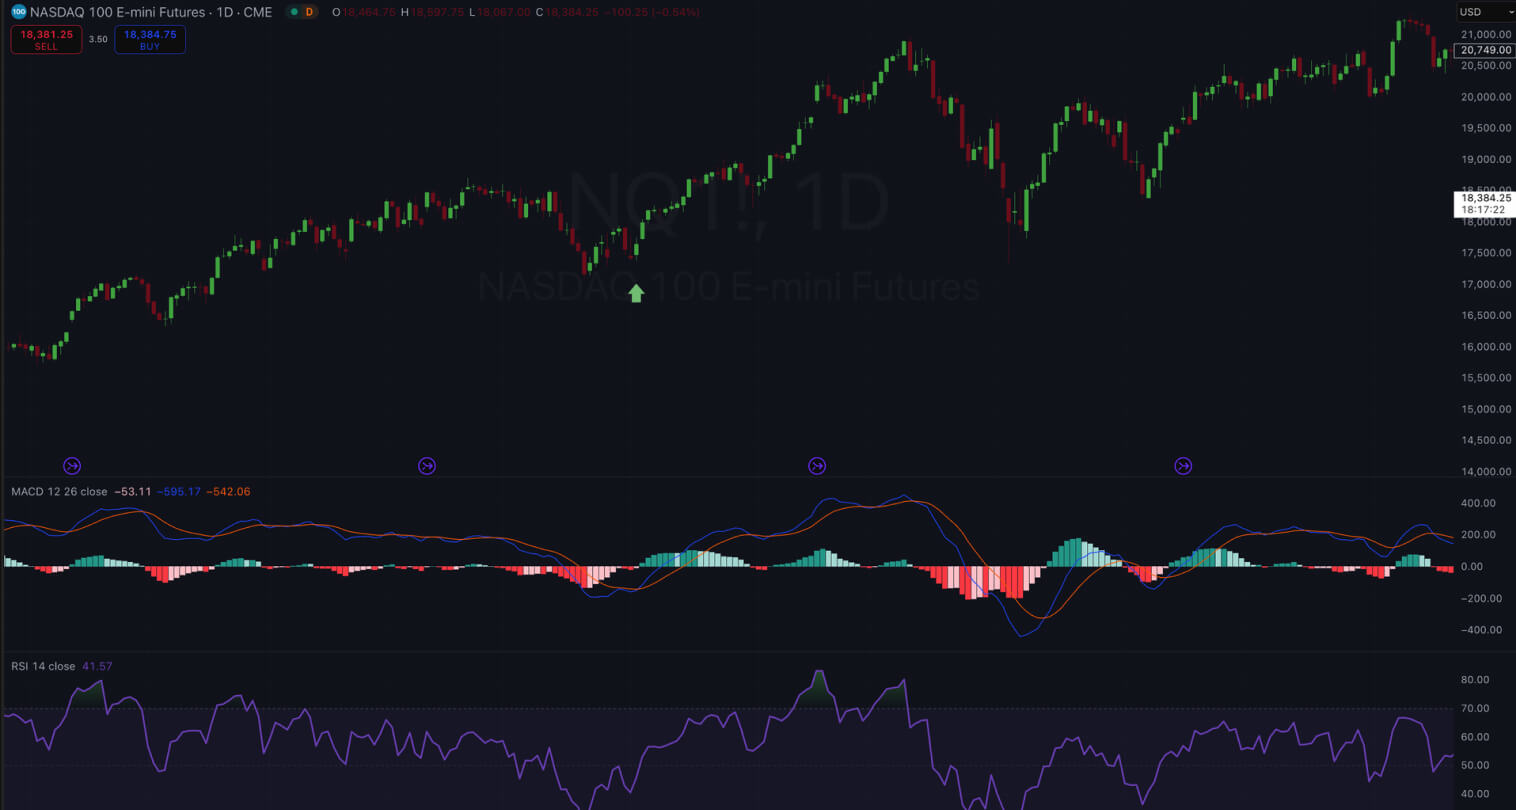
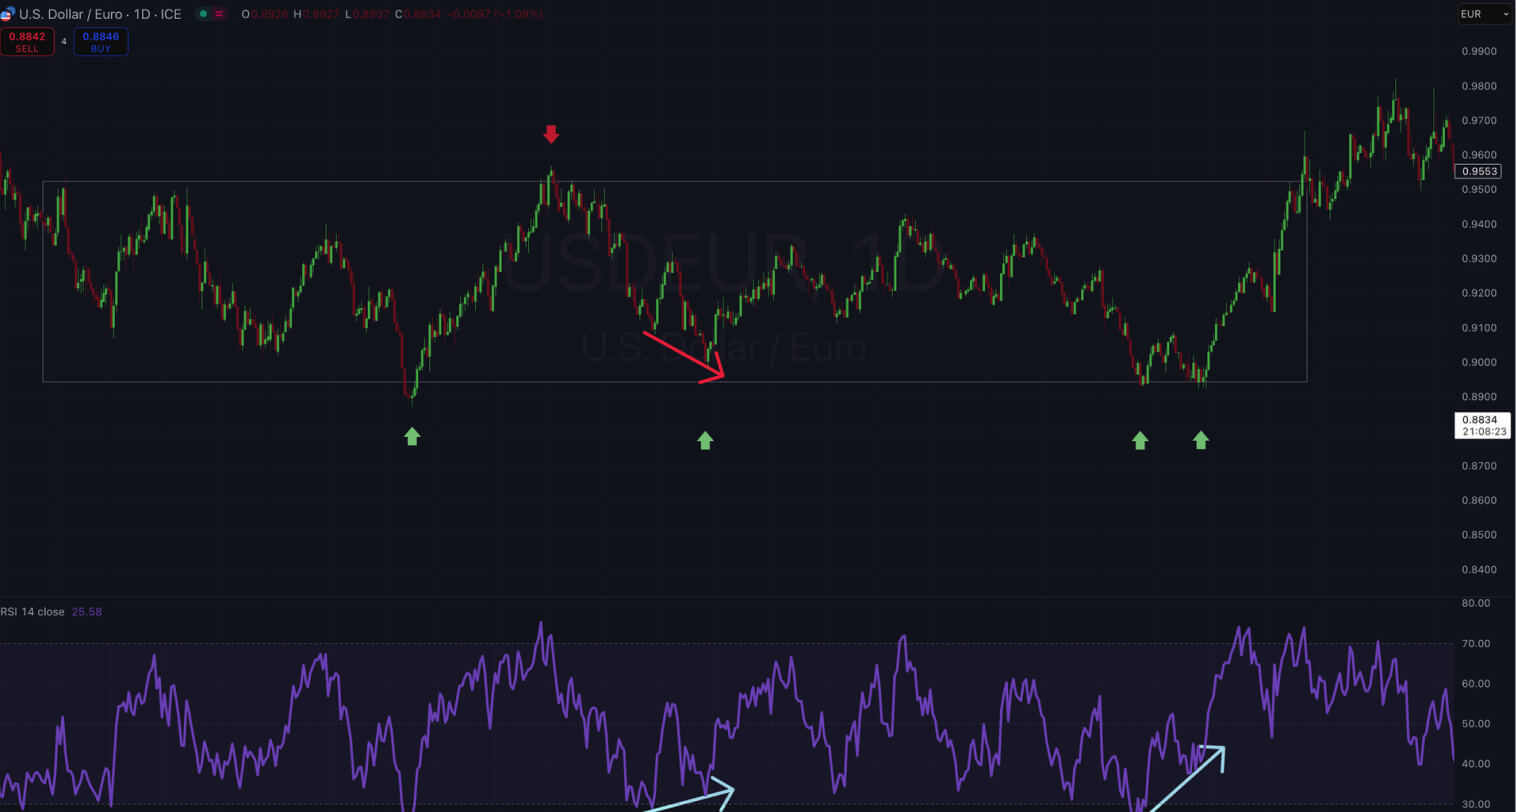
In the image above, both RSI and MACD indicated that prices could still move upwards after pulling back amid bullish momentum. The RSI went all the way down towards 30, indicating oversold conditions, then started raising again while the MACD line crossed above the signal line shortly after with a rising histogram. This gave traders early confirmation of bullish momentum resurfacing.
Avoiding False Signals
Every technical indicator is prone to misleading signals. You can avoid traps by placing the indicator in the overall context.
- Check the Trend First: Signals aligned with the dominant trend are more reliable. Use moving averages or higher timeframes to define the predominant trend.
- Confirm Signals with Price Action: If the RSI indicates oversold conditions, check whether prices are around known support levels or if reversal patterns are forming. A bullish signal near a trendline break, for example, adds extra weight. Price is what confirms what indicators can only suggest.
- Check Volume and Volatility: Higher volume means higher credibility. Always check if a signal is backed up by larger-than-average market participation. Lower volumes may lead to false signals and erratic movements.
- Wait for the Candle to Close: Avoid entering a trade mid-candle. Indicator signals are more trustworthy after the candle closes. Only act if the signal still exists after the section is over.
Before acting on an indicator, run through a quick checklist:
- Is the signal aligned with the trend or am I fighting the current trend?
- Does the price chart show any support or resistance levels, or patterns, that support my trade?
- Is there convergence between indicators? Do multiple signals point in the same direction?
- Before jumping in, did I wait for the candle to close or the next bar to confirm the signal?
- Is there any other factor, like news or macro events, that could invalidate my technical indicator signals?
Never act on a single indicator or signal. Strong signals have context, structure, and confirmation. False signals don’t. Use a checklist, your experience, and discipline to separate relevant from irrelevant trading signals. It is always better to miss a trade than to chase a sequence of bad trades.