How to Interpret the Ichimoky Cloud and its Components
To successfully trade with the Ichimoku Cloud indicator, you must understand the core components behind an Ichimoku strategy. The components of the Ichimoku are:
- Tenkan-sen (Conversion Line): The midpoint of the highest high and lowest low over the past 9 periods by default. This is a short-term line that reflects the short-term trend and momentum. A rising Conversion Line is an indicator of an upward trend in the short term, while a flat one indicates a sideways market. It can also act as a small support/resistance level during pullbacks. It is calculated as (9-period high + 9-period low) / 2.
- Kiju-sen (Base Line): The midpoint of the highest high and lowest low over the past 26 periods. The Base Line serves as a medium-term indicator of the trend. If prices are above it, the market is bullish. If prices are below it, the market is bearish. Traders use the Base Line as a confirmation line for trend shifts, as well as a trailing stop. It is calculated as (26-period high + 26-period low) / 2.
- Senkou Span A (Leading Span A): The average of the Conversion Line and the Base Line, plotted 26 periods ahead of the current period. This line forms one boundary of the cloud. It moves relatively faster and will be the upper edge of the cloud in a bullish trend or the lower edge in a bearish trend. It gives a projected support and resistance level ahead of the current price. It is simply calculated as (Conversion Line + Base Line) /2.
- Senkou Span B (Leading Span B): The midpoint of the highest high and lowest low over the past 52 periods. It is plotted 26 periods ahead, serving as the other boundary of the cloud. Leading Span B, however, changes more gradually and identifies major support or resistance zones. It is calculated as (52-period high + 52-period low) / 2.
- Kumo (Cloud): The cloud is simply the shaded area between Span A and Span B. It represents an entire zone of support or resistance. It tells you a lot about the trend as well. If prices are above the cloud, the market is bullish. If prices are below the cloud, the market is bearish. The cloud is colored green for uptrends and red for downtrends. Its thickness is closely related to volatility. More volatility leads to thicker clouds, highlighting stronger support or resistance.
- Chikou Span (Lagging Line): The current period’s closing price shifted 26 periods farther back on the chart. This lagging line shows how today’s price compares to the price 26 days ago if we’re analyzing a daily chart. We can get confirmation of momentum by looking at where the Lagging Line is placed compared to the current price. If the Lagging Line is above current prices, momentum is bearish; if below, momentum is bullish.
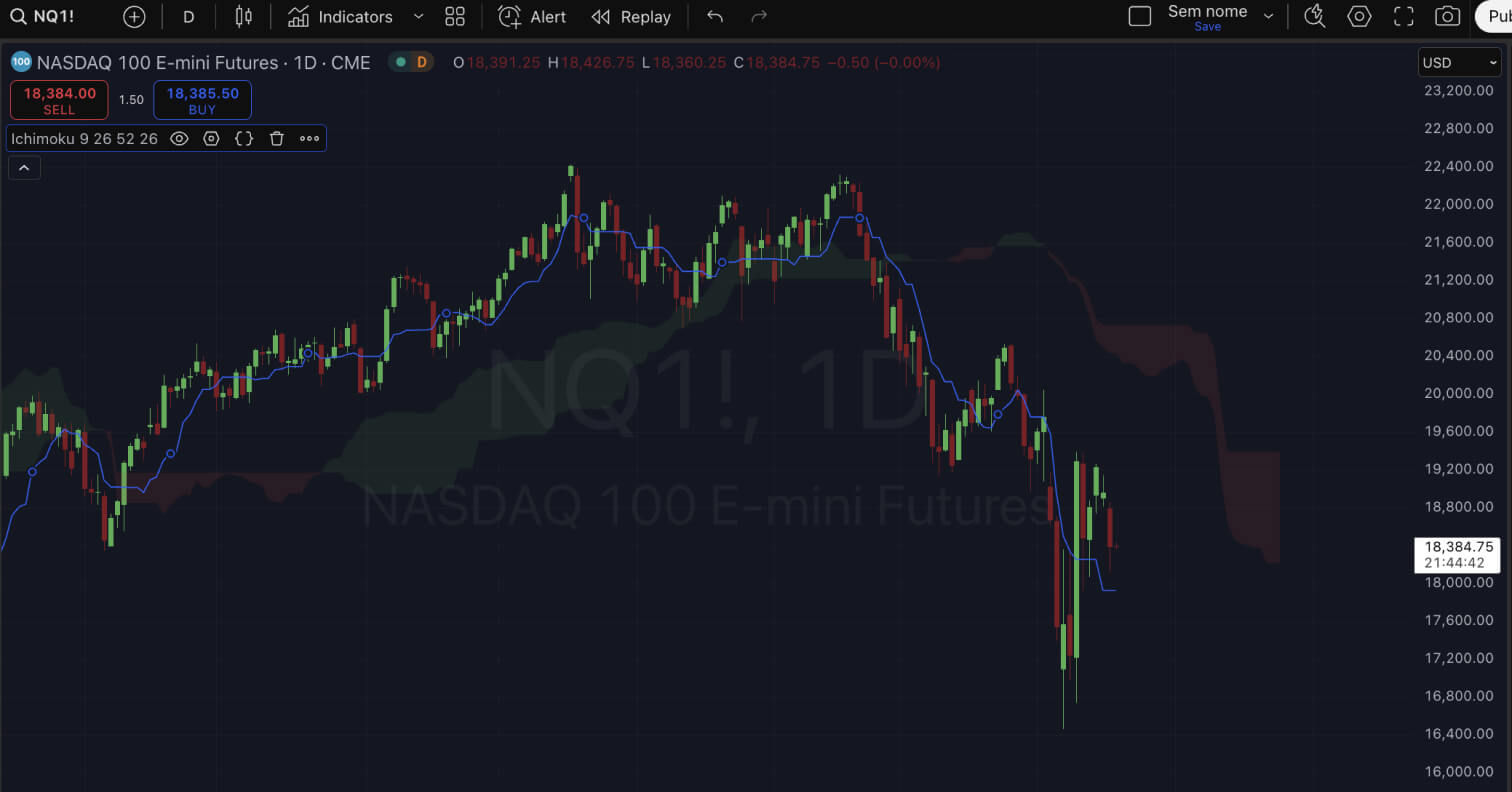
Identifying each component of the Ichimoku Cloud on a chart might be a bit tricky at the start. In the example below, using the standard Ichimoku Cloud indicator available on TradingView, the Conversion Line is the blue line, moving closely to the price candles. The dark red line is the Base Line moving closely to the Conversion Line. The cloud is the shaded area formed between Span A (light green line) and Span B (light red line). The Lagging Line is the dark green line plotted behind prices.
How to Trade with the Ichimoku Cloud Strategy: Learning to Use and Interpret Chart Signals
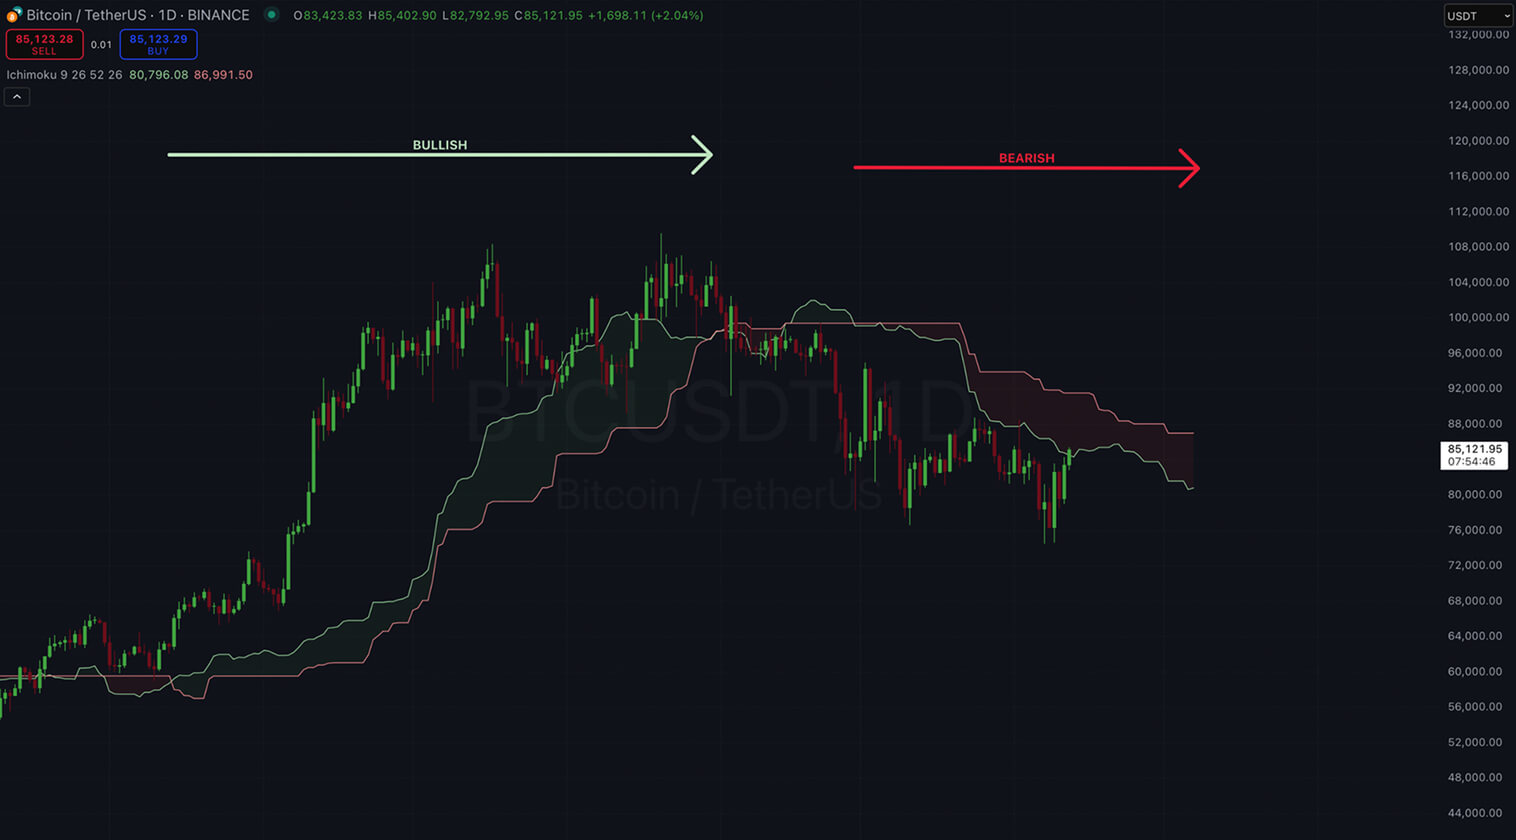
You can quickly capture info on trends by observing where the price is positioned relative to the cloud. If the price is above the cloud, the trend is considered bullish. If prices are below the cloud, bears are winning over bulls. The color of the cloud also points toward the market direction. When bullish, the cloud is colored green; when bearish, it is colored red. On TradingView, we can select to view only the cloud to filter additional information and assess only the trend.
When the price is trading within the cloud, or the cloud is way too narrow, the market is consolidating and moving sideways. This is an indication of uncertainty, where neither bulls nor bears are in control of price action. Under this situation, traders wait for the price to break out of the cloud before making any entries. A breakout above the cloud could signal the beginning of an upward trend, while a breakout below the cloud suggests a downtrend. The Kumo Twist, when two cloud boundaries cross, also indicates potential trend reversals.
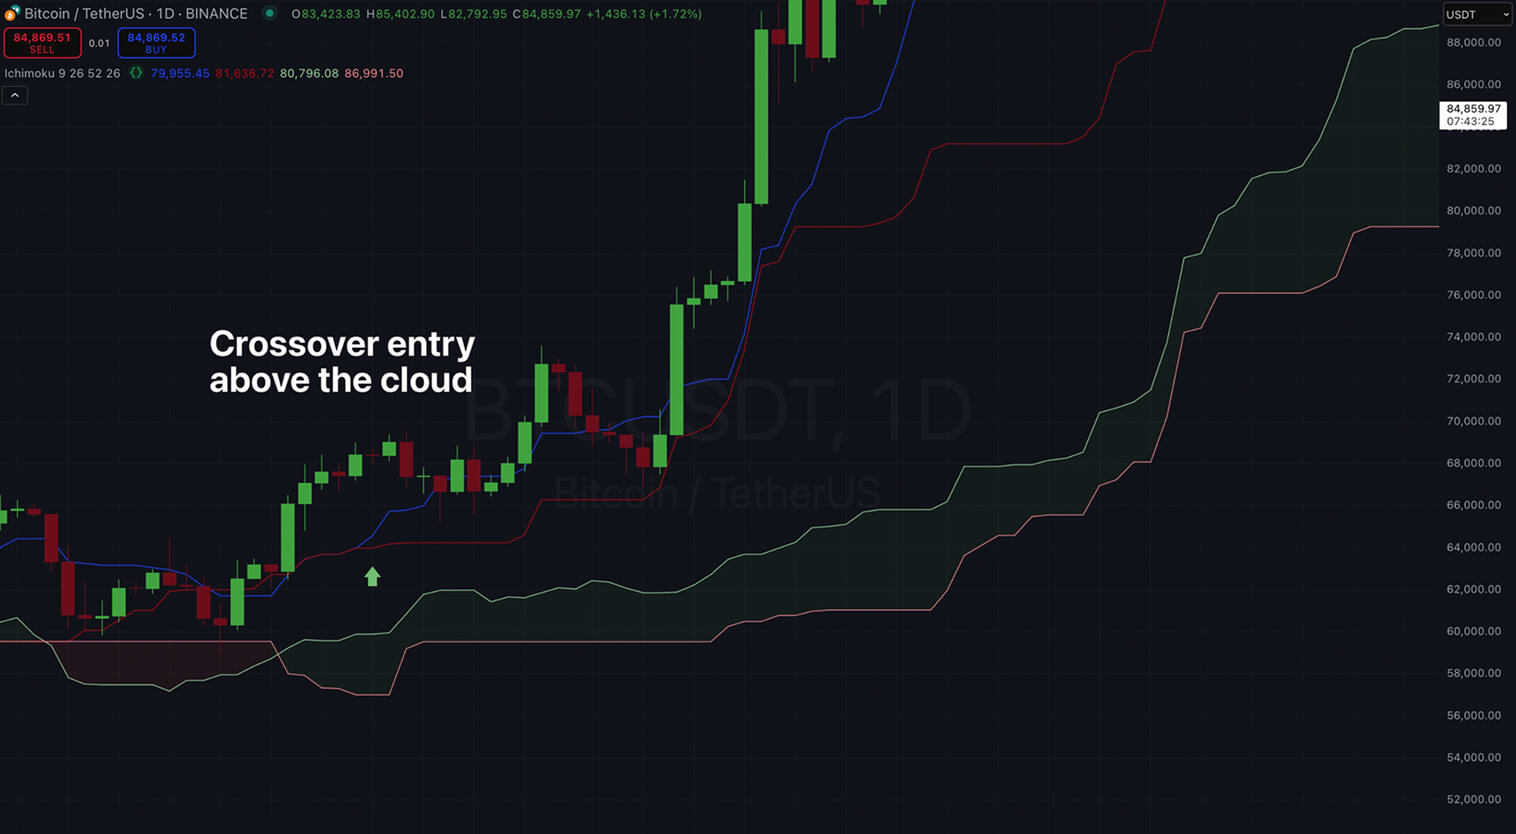
Overall, each line in the entire Ichimoku system acts as dynamic support and resistance levels. In an uptrend, both the Conversion Line and Base Line offer potential buy entries due to their role as support levels. In a bearish trend, these lines will move above the price and serve as barriers against bulls. Crossovers between Conversion and Base Lines also generate trade signals. A bullish crossover (Conversion above Base) is especially strong when happening above the cloud. A bearish crossover (Conversion below Base) is most powerful below the cloud.
Trading Strategies: How to Use the Ichimoku Indicator
The Ichimoku Cloud can be applied to several trading strategies on different timeframes. Some common approaches include:
- Cloud Breakout Strategy: This is one of the most straightforward Ichimoku strategies. You enter precisely when price breaks out of the cloud, indicating an emerging trend. In a buy scenario, you wait for the price to close above the cloud, confirming a shift to an uptrend. The same is true for a sell setup but you’ll wait for prices to close below the cloud. The stop-loss trigger could be set beyond the opposite side of the cloud, considering a move back inside indicates a false breakout. The take-profit trigger could be set at the next support or resistance level, or based on additional chart patterns or trendline analysis techniques.
- Conversion Line/Base Line Crossover Strategy: This strategy consists of trading based on crossovers between the Conversion Line and Base Line while using the cloud as a filter. A bullish crossover happens when the Conversion Line crosses above the Base Line, given how the first line reflects more recent trends and the latter reflects a longer trend. To improve reliability and strength, many traders prefer going long when this setup occurs while prices are above the cloud, so your entry is in harmony with the prevailing trend. For even further confirmation, traders can use the Lagging Line to check if it confirms the signal. This strategy helps to find optimal entries when pullbacks happen.
- Day Trading: The Ichimoku Cloud works well on intraday timeframes like 15-minute or 1-hour charts. Many day traders stick to the default settings, although some prefer to shorten the default periods to make it more responsive in more fast-paced markets (intraday crypto price action, for instance). It is, though, important to notice that you might end up having more frequent signals and noise. A good strategy is using a higher timeframe as a filter. You can check the 1-hour cloud to capture the most prominent trend while looking at the 15-minute chart to capture entry signals aligned with the main trend in the hourly chart.
- Swing Trading: Ichimoku’s signals are fewer but more significant on higher timeframes, like daily or weekly. Swing traders usually stick to the standard settings and use the Ichimoku to identify the primary trend and key levels. They often choose to enter in the direction of the trend, identified by looking at the cloud’s colors and where prices are located in relation to it. Crossovers between the Conversion Line and Base Line are used to trigger entries and exits.
Trading Signals: Buy and Sell Triggers for Traders
Reliable signals occur when multiple components align. Let’s take a look at good examples for Bullish and Bearish signals.
“All Clear” Bullish Signals
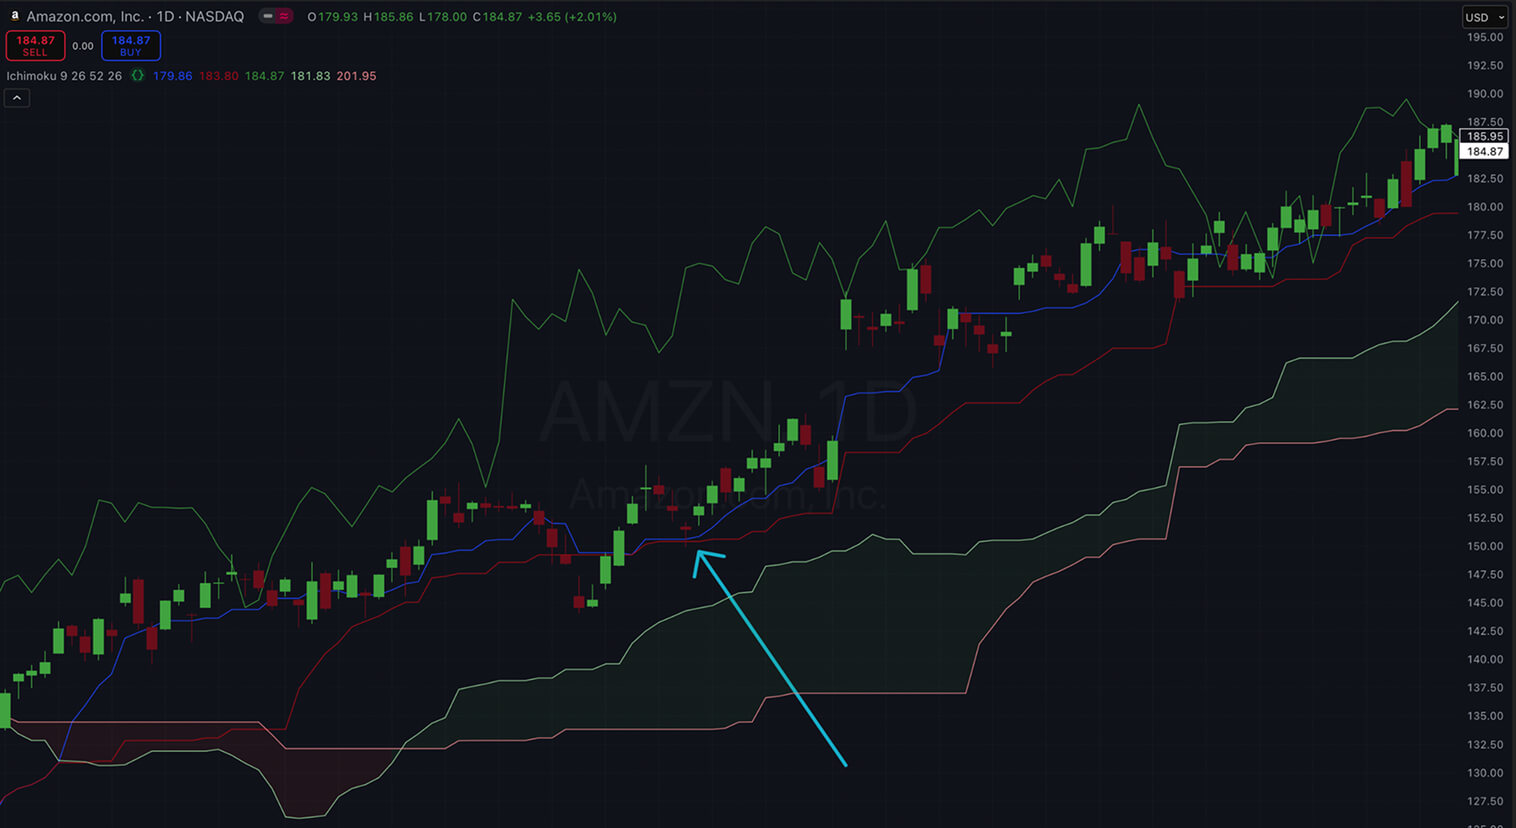
An all-clear signal happens when the price is above the cloud, which is colored green. When the Conversion Line is above the Base Line and the Lagging Line is above the price curve, we have the ideal scenario to go long. In the example below, notice how all lines point towards bullish momentum. We have an opportunity to go long when prices form a doji-like figure at the Base Line, during a brief pullback while all the signals remain bullish.
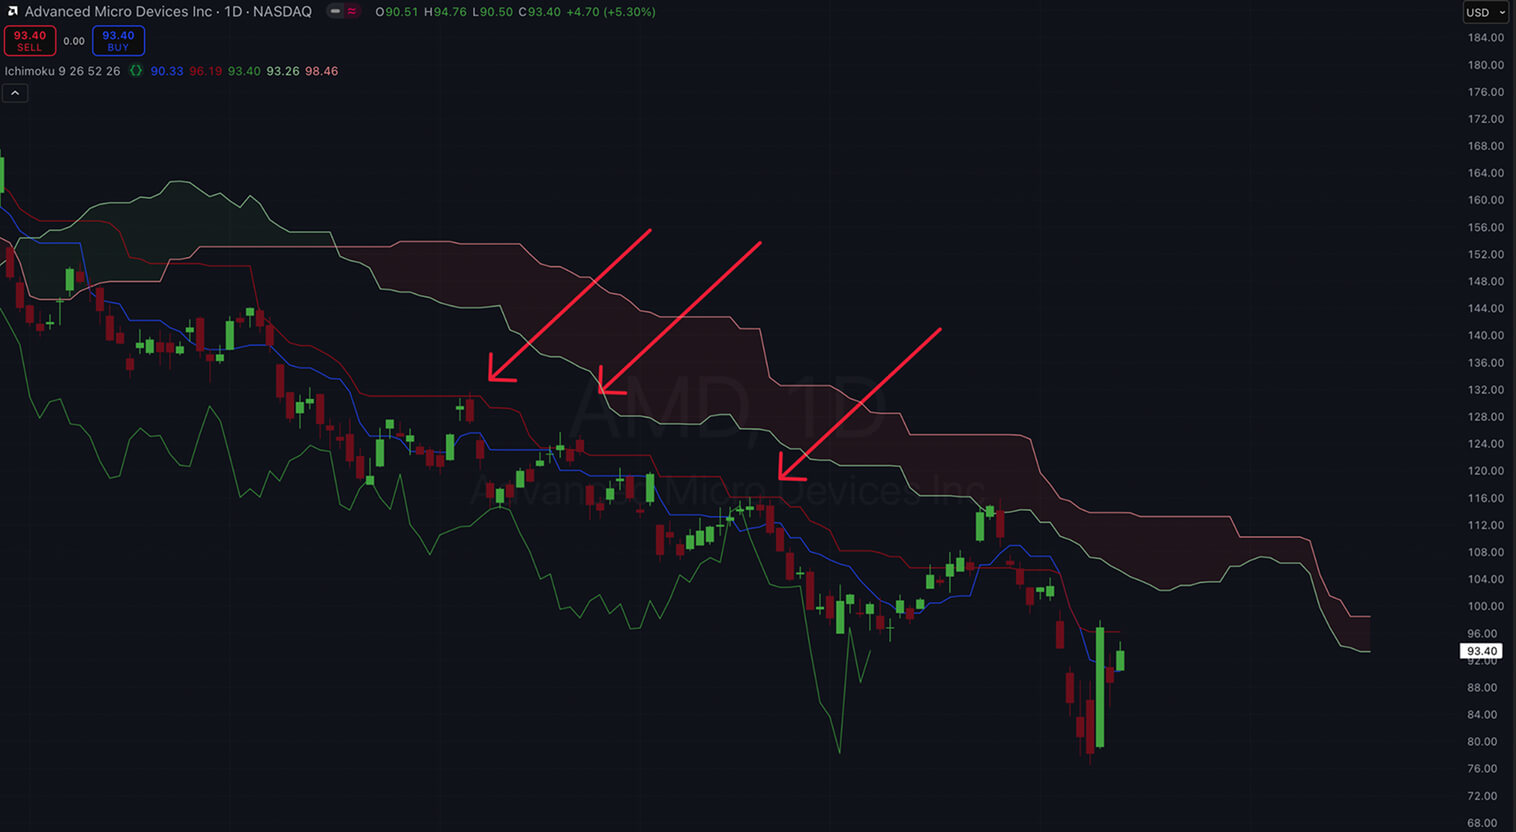
“All Clear” Bearish Signals
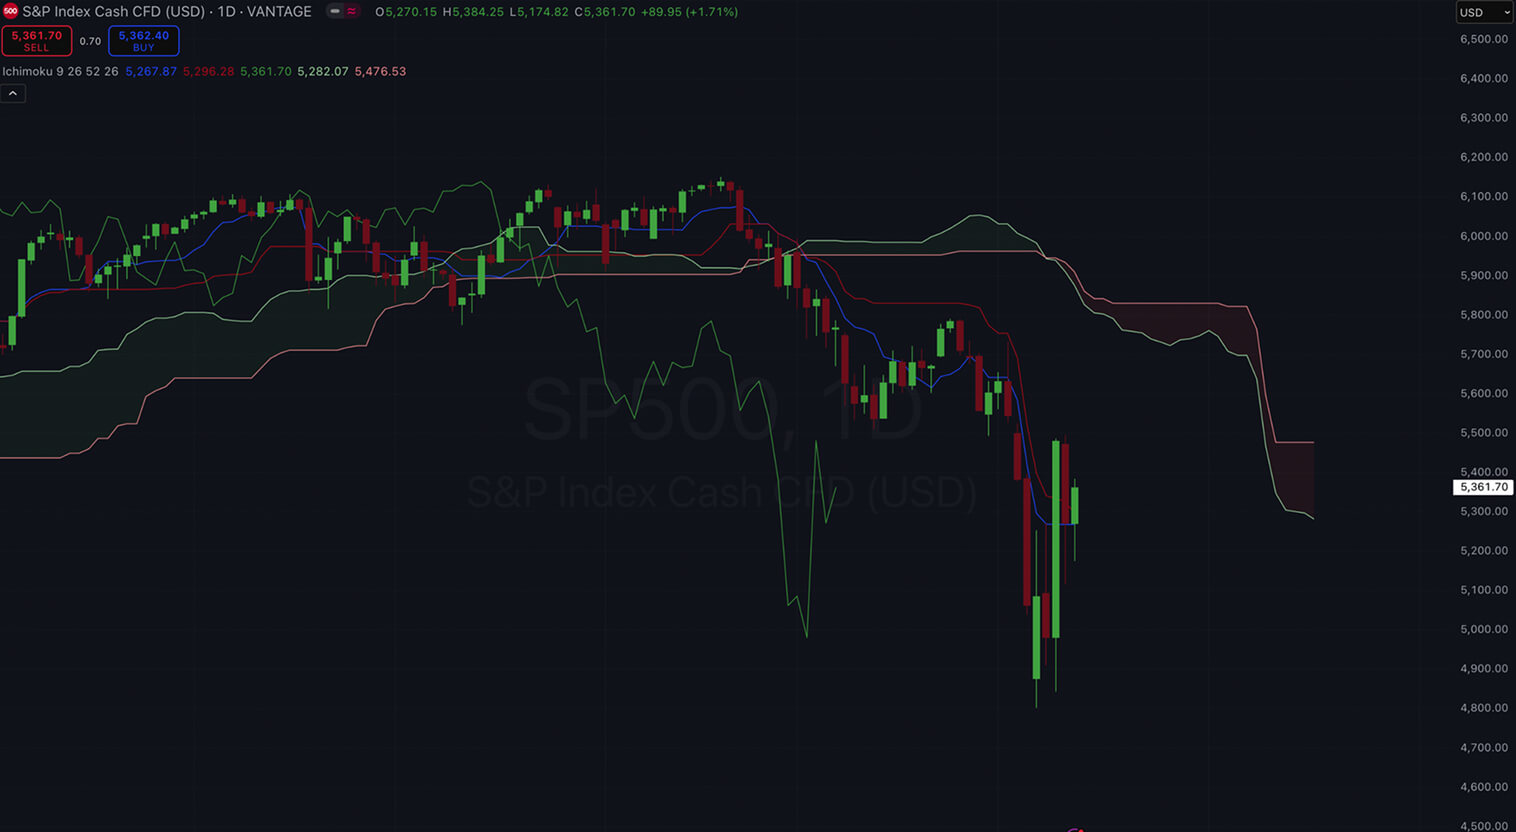
While focusing on bearish setups, the opposite holds true. Prices should be below the cloud, the Conversion Line should be trending below the Base Line, the cloud ahead must be read, and the Lagging Line should be below the price. This alignment provides a strong confirmation of a bearish trend.
Parameter Setup and Customization to Trade the Ichimoku Technical Indicator More Effectively
Overall, the default settings for the Ichimoku Cloud are 9, 26, and 52. The cloud is shifted 26 periods forward. These values were defined by Hosoda based on the cycles of the Japanese market. In this case, 9 days represent one and a half weeks, 26 days represent one month, and 52 days represent two months.
Most traders use the default settings across timeframes and assets. If you backtest and find that the standard settings do not suit your trading system, you can tweak them. Some traders like to experiment with shorter settings like 8-22-44 and 6-24-48 to make the Ichimoku more sensitive to recent price changes—especially useful in highly volatile cryptocurrencies or forex pairs. The most significant trade-off of faster parameters is the increase of false signals. Longer settings like 12-30-60 can smooth market movements and filter out noise.
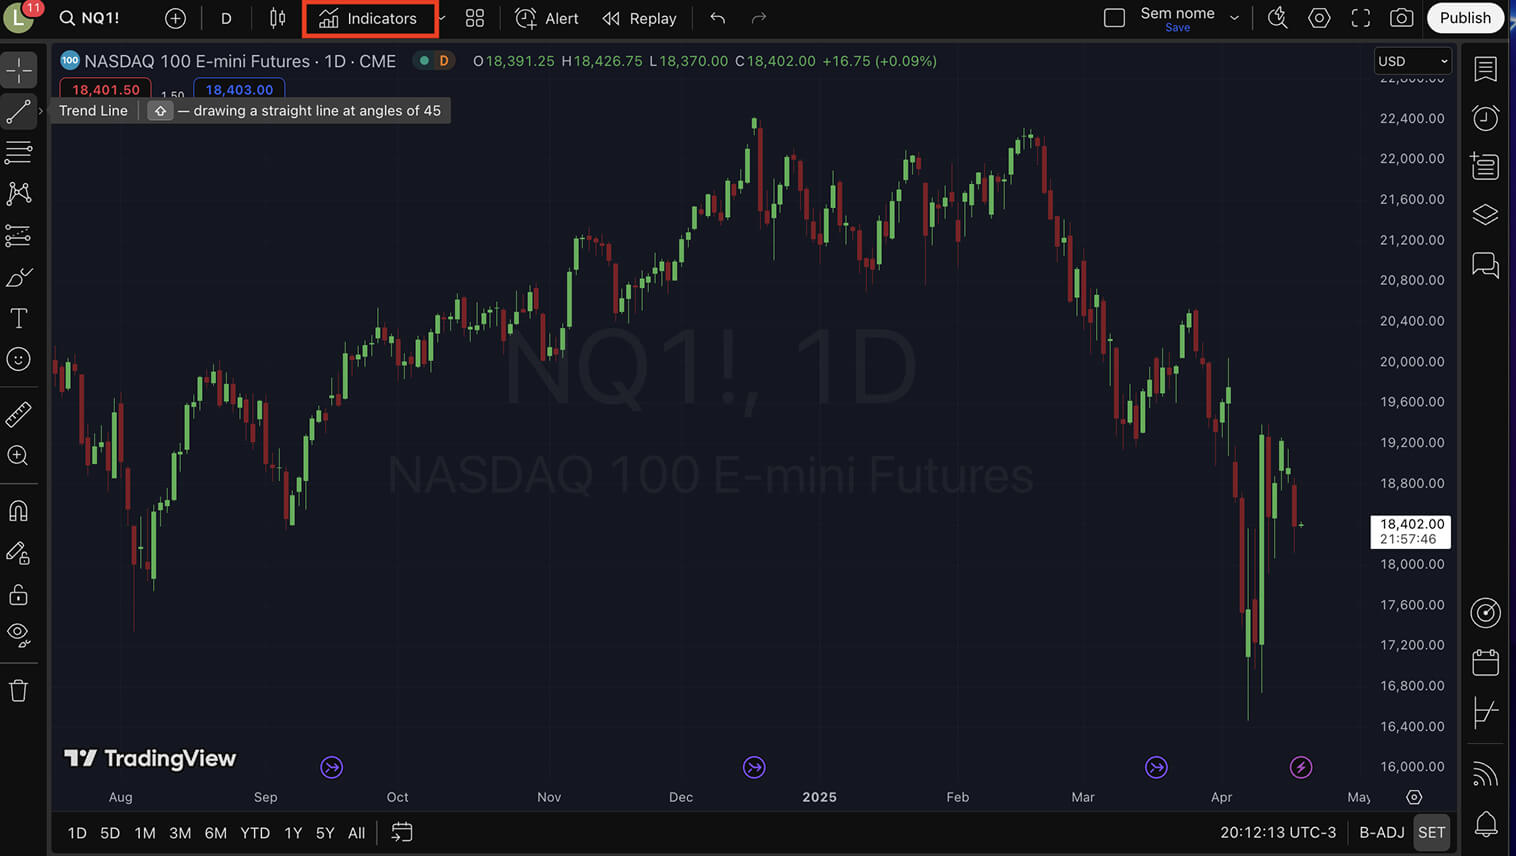
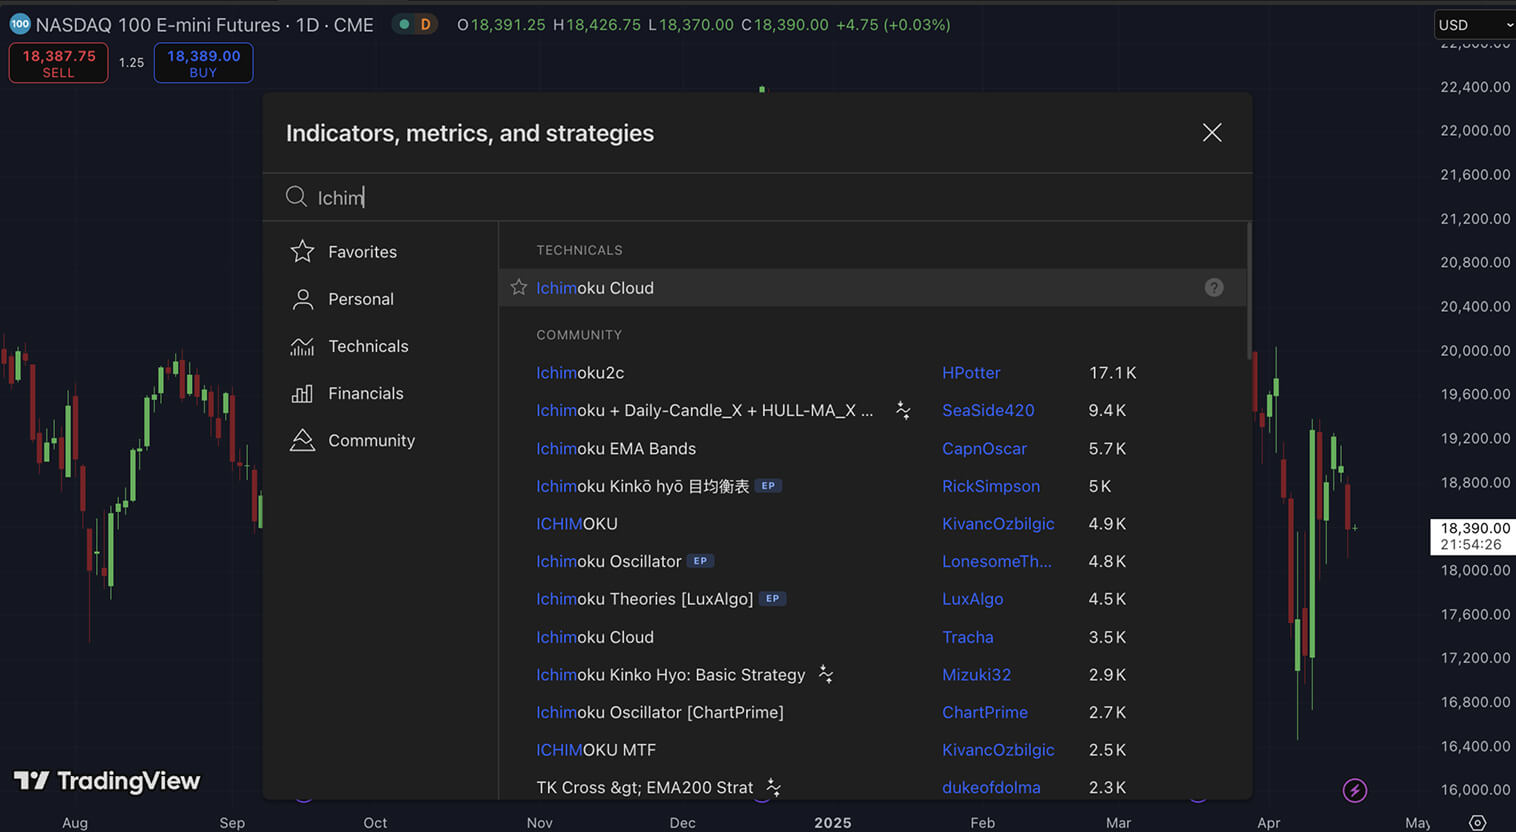
Configuring the Ichimoku Cloud on TradingView is simple and very straightforward. You start by clicking on the Indicators button in the top menu of the chart.
Once the Indicators, metrics, and strategies menu appears, you can search for Ichimoku Clouds. The indicator below Technicals is built by TradingView, but there are also several versions and adaptations of the indicator built by the community. Feel free to explore the indicators created by the community. Some of them are really well crafted and might be a great fit for your trading system. In this article, we will focus on the default version provided by TradingView.
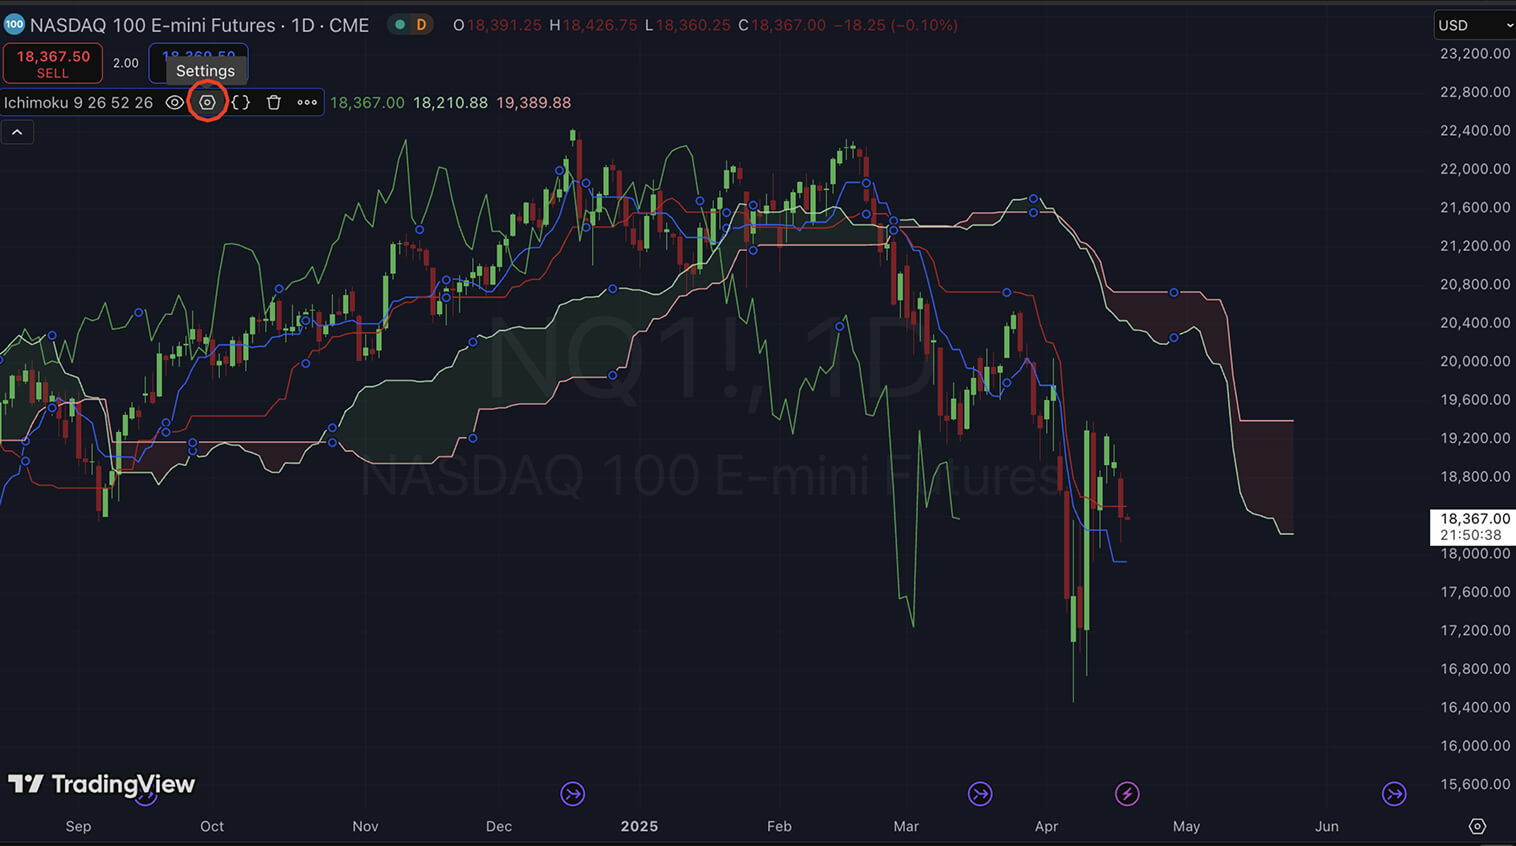
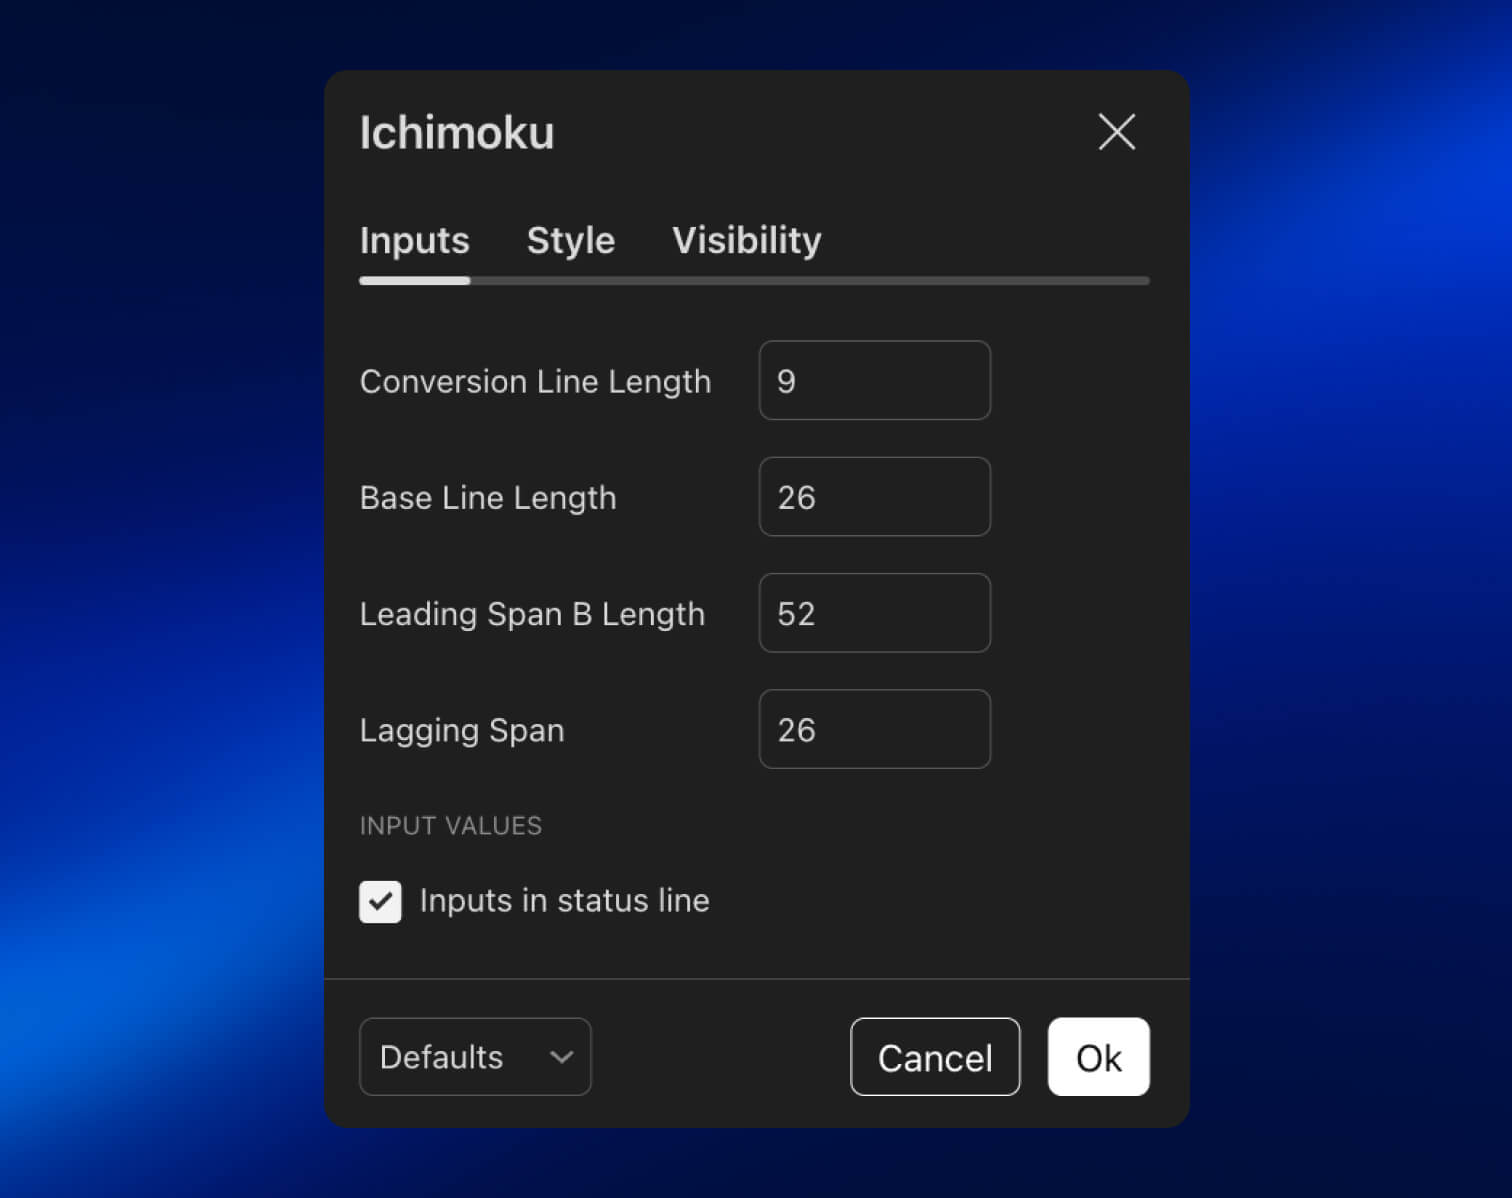
The indicator will then be available to you and on display in your price chart. At this moment, we have all the default settings (9, 26, and 52). By hovering over the top right menu containing the name of the indicator and its key parameters, you will be able to click and open the indicator’s settings.
In the settings menu, you will have three different tabs. Style allows you to change the colors and select whether you’d like to visualize a line or not in the indicator. We can choose to only plot the clouds and the Conversion Line, for example.
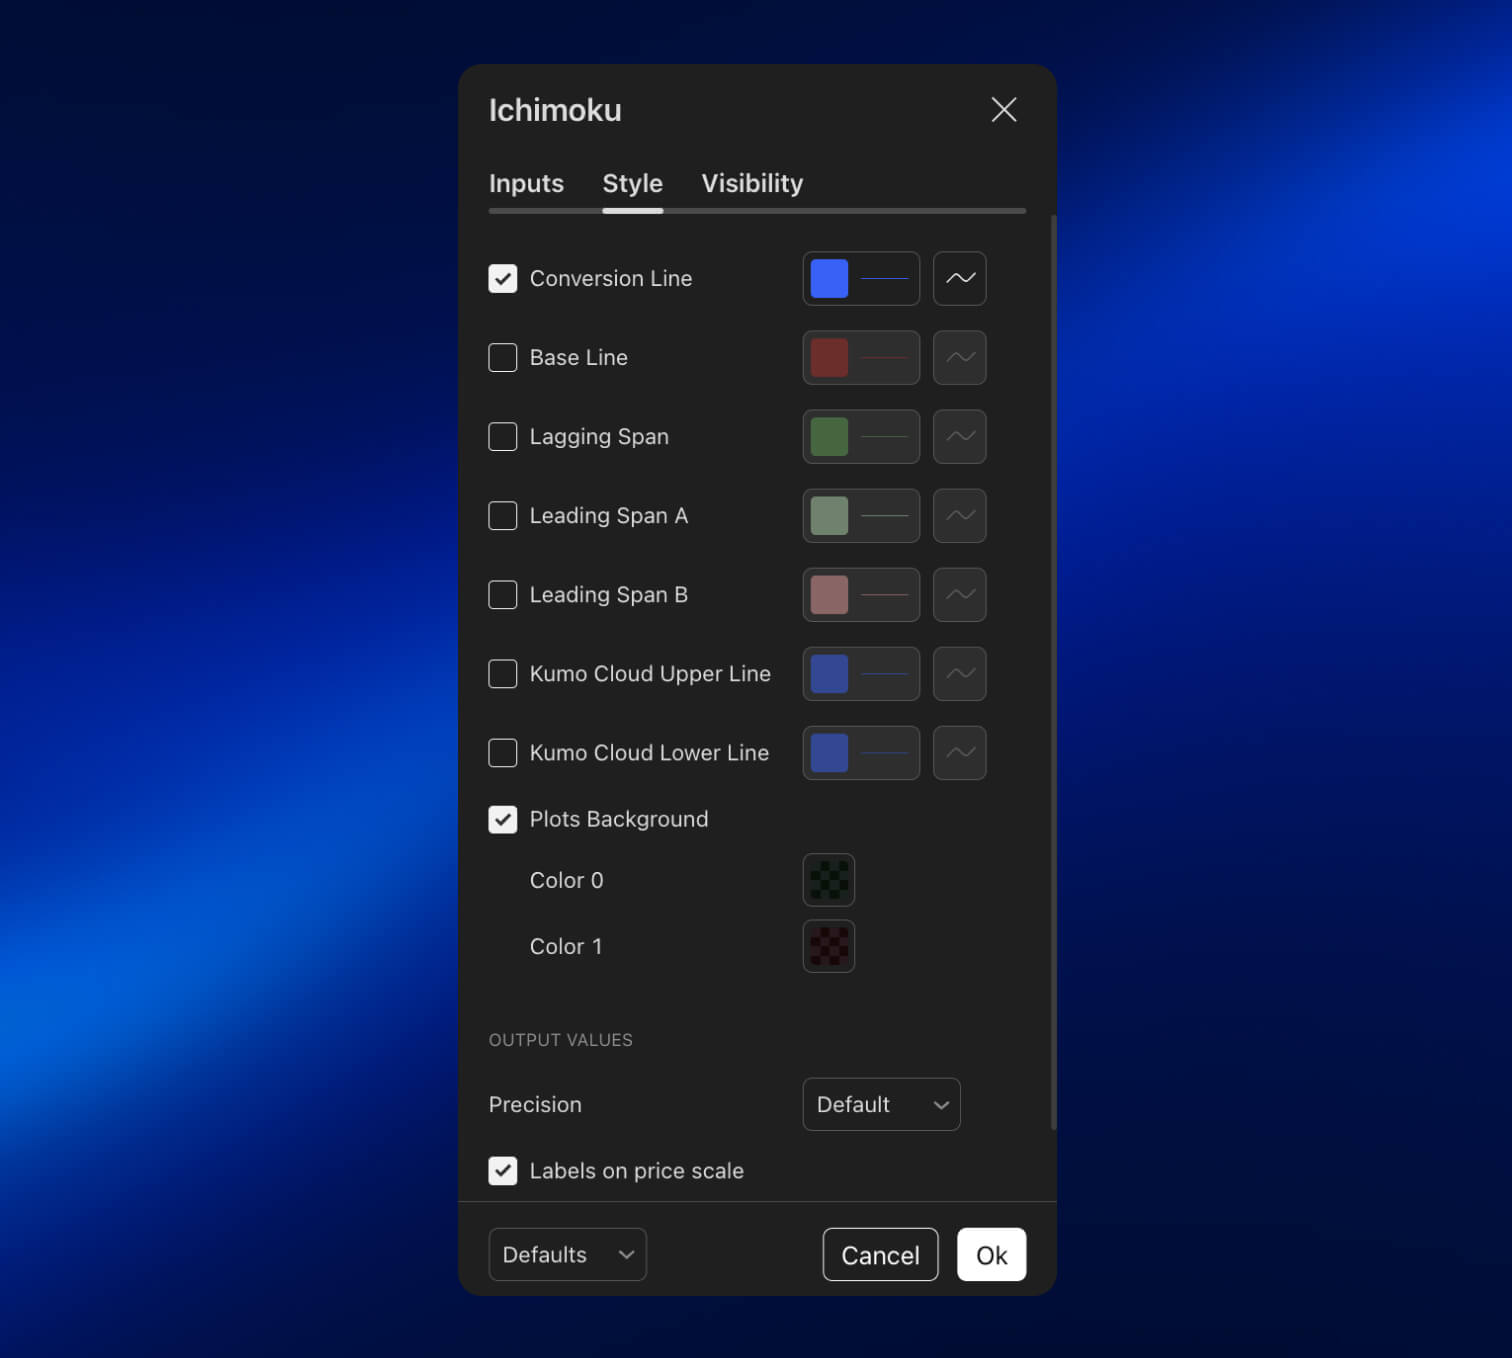
By selecting different lines and changing colors in the Style tab, you will be able to make the indicator cleaner and more familiar to your color patterns. The Inputs tab, on the other hand, is where you will customize the indicator’s main parameters. This must be done carefully, and it is always suggested to backtest after changing these numbers because they highly affect the indicator’s behavior, triggers, and performance.
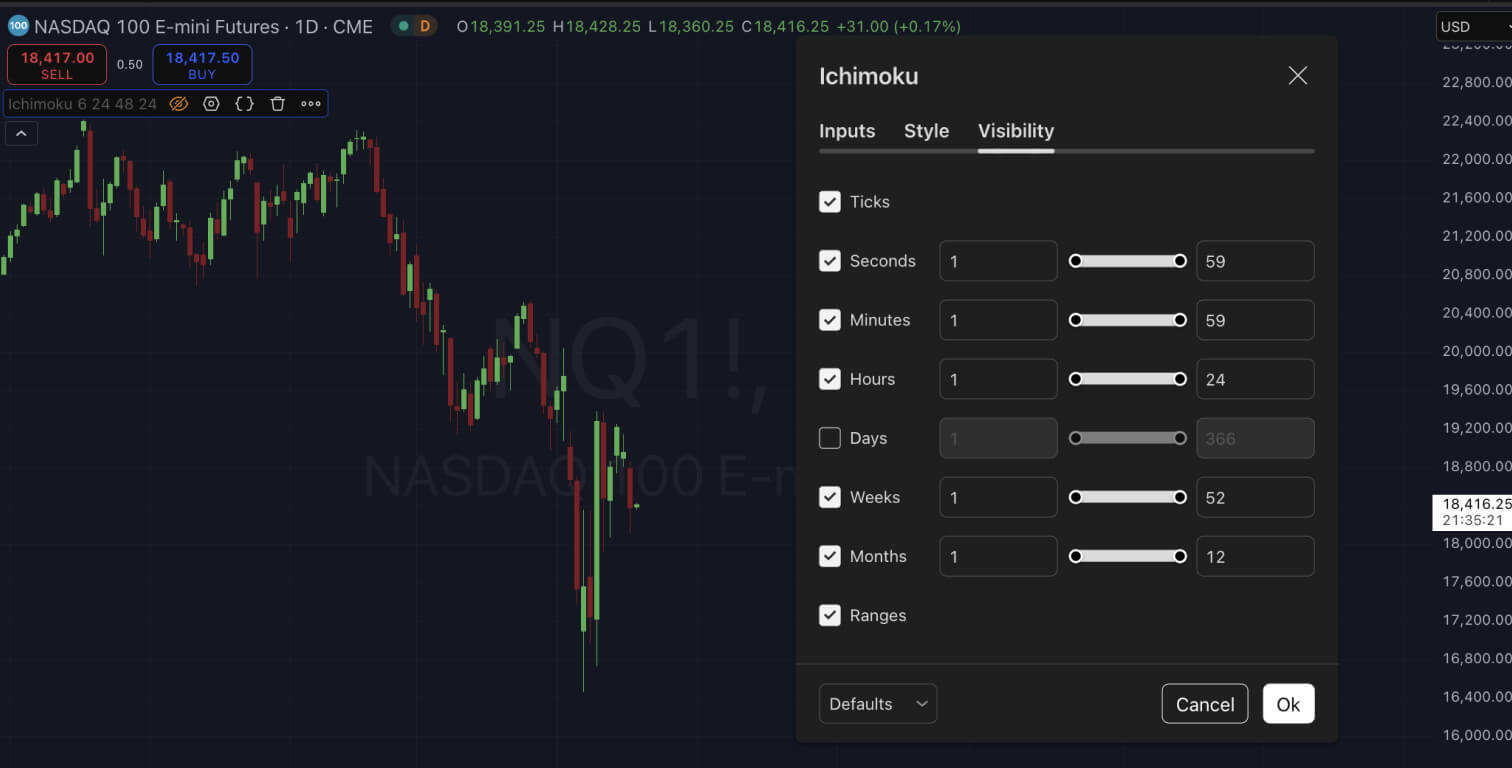
Below you can see how the indicator looks different on a shorter setting (6, 24, 48) for the Base Line, Conversion Line, and Lagging Line. These changes highly affect the behaviors in the Ichimoku chart.
Below, we have the last tab, called Visibility, where you control on which timeframes the indicator will appear on the chart. By unselecting the Days box, the indicator will disappear from the daily chart and will only be visible when we change the timeframe.
Use Ichimoku Cloud with Other Indicators
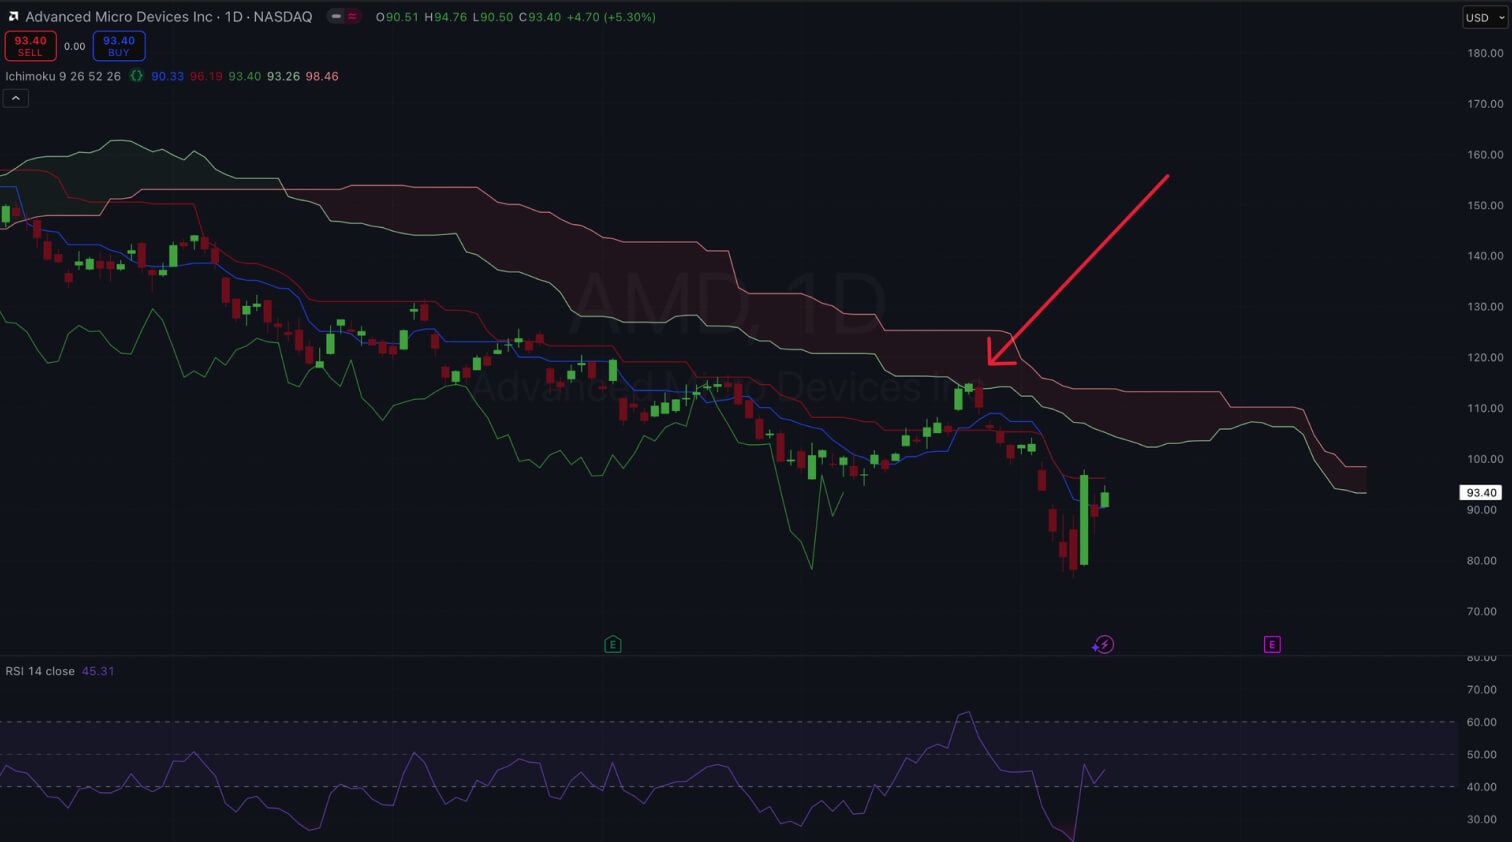
You can include other indicators in your trading system alongside the Ichimoku clouds to confirm trends and reduce false signals. You can use the RSI to check if it stands above 50 when prices break above the close, confirming the bullish momentum. On the other hand, if the RSI has been long overbought or is diverging, it can be a warning that the breakout doesn’t have enough strength to go much further. The example below displays how you can use the RSI to identify overbought regions during a pullback amid a downtrend, allowing you to open short positions at an optimal point while the cloud is bearish. Notice how I am using custom settings, where 60 and 40 mark the extreme zones for the RSI.
A cloud breakout accompanied by a high trading volume is also more potent than one on a low volume since that indicates a larger financial participation behind price action.
Minimizing Risks: The Importance of Risk Management
Risk management is the most important component of any trading system. This is not different for trading systems that use the Ichimoku Cloud indicator. Risk parameters must always be defined before entering a trade. As I’ve mentioned on several other indicators, it is ideal to risk no more than 2% of your trading capital per trade. The Ichimoku Cloud comes with several lines you can use as stop-loss triggers, most typically the Base Line.
Position sizing can be a bit tricky. It is recommended to choose a position size that reflects the asset’s volatility and the account size. In highly liquid markets like forex and crypto, you can place looser stop-loss triggers, accounting for the more explosive price movements. In stocks and calmer markets, you set stop-loss orders that are a bit more tight. Always ensure a risk-reward ratio that is favorable in the long term, from 1:2 to higher ratios. In this case, if your stop-loss is -2%, your target should be at least +4%.
Besides the technical aspects, it is essential to keep control of your emotions. Do not chase trades; avoid increasing position size in an attempt to make up for past losses. Develop a risk management plan to preserve your capital and be disciplined to objectively follow it. Long-term survival is essential.
Common Mistakes to Avoid
Some of the most common mistakes that beginners make when starting to trade with Ichimoku Clouds are:
- Entering the Market While Prices are Inside the Cloud: This is a sign of indecision and lack of trend, which can lead to unreliable signals and erratic price movements.
- Counter-Trend Entries: Entering trades by relying on counter-trend signals can be rewarding but also riskier. More often than not, these signals fail and lead to financial losses. For beginners, it is best to avoid counter-trend trading.
- Overconfidence in One Single Component: Entering trades solely based on crossovers between Base Line and Conversion Line without considering other aspects of the entire system, like cloud color and Lagging Line position, also leads to financial losses and bad entries.
- Ignoring Trading Volume: Trading volume is a key indicator of any winning trading system. Always ensure to confirm the Ichimoku signals with the trading volume or even additional indicators like the RSI to confirm signals.
Conclusion
The Ichimoku Cloud offers a quick overview of market conditions, capturing momentum and trends easily and effectively, allowing traders to understand what is going on with a quick glimpse. Although a powerful technical indicator, it requires practice to truly understand how to read its signals properly.
It is a must to practice with Ichimoku on historical charts and demo accounts to build confidence and knowledge in how to read its signals. It is also noteworthy to remember that indicators work best when used within a broader trading system. Once you’ve mastered the intricacies of Ichimoku Clouds, you can combine it with more advanced trading strategies, such as the Wyckoff Method or scalping techniques.
With experience, you will be able to successfully aggregate the Ichimoku Clouds to your trading arsenal, helping to level your skills up.